

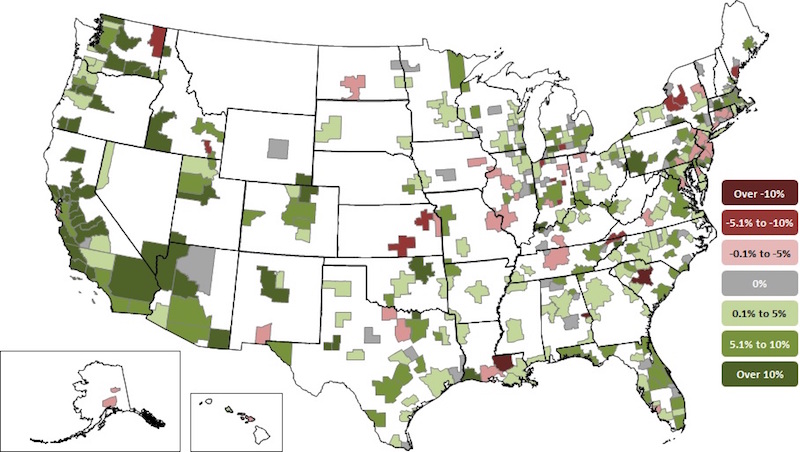
Construction employment increased in 257 out of 358 metro areas between February 2017 and February 2018, declined in 50 and stagnated in 51, according to a new analysis of federal employment data released today by the Associated General Contractors of America. Association officials said that the employment gains are occurring as construction firms in many parts of the country are having a hard time finding enough qualified workers to keep pace with demand.
"Growing private-sector demand for construction services is prompting construction firms to hire more people to complete projects," said Ken Simonson, the association's chief economist. "Yet tight labor markets, particularly for qualified construction workers, is making it increasingly difficult for firms to find people to bring on board."
Riverside-San Bernardino-Ontario, Calif. added the most construction jobs during the past year (12,000 jobs, 13%), followed by Phoenix-Mesa-Scottsdale, Ariz. (9,900 jobs, 9%); Dallas-Plano-Irving, Texas (9,700 jobs, 7%); Houston-The Woodlands-Sugar Land, Texas (9,300 jobs, 4%) and Los Angeles-Long Beach-Glendale, Calif. (7,700 jobs, 6%). The largest percentage gains occurred in the Merced, Calif. metro area (33%, 700 jobs) followed by Midland, Texas (22%, 5,400 jobs); Lake Charles, La. (21%, 4,700 jobs) and Weirton-Steubenville, W.V.-Ohio (21%, 300 jobs).
The largest job losses from February 2017 to February 2018 were in Baton Rouge, La. (-6,500 jobs, -12%), followed by St. Louis, Mo.-Ill. (-2,500 jobs, -4%); Columbia, S.C. (-2,200 jobs, -11%); Fort Worth-Arlington, Texas (-2,000 jobs, -3%) and Middlesex-Monmouth-Ocean, N.J. (-1,700 jobs, -5%). The largest percentage decreases for the year were in Auburn-Opelika, Ala. (-38%, -1,500 jobs) followed by Baton Rouge, Columbia, S.C. and Kokomo, Ind. (-9%, -100 jobs).
Association officials said that growing private sector demand in February is prompting many firms to add more staff as they work to complete projects. They added that the recently-enacted federal spending measure includes up to $10 billion in additional infrastructure funding for this year, meaning firms that perform public-sector work are likely to begin expanding as well amid tight labor market conditions.
"As demand for construction continues to expand, it will only get harder for many firms to find qualified workers to hire," said Stephen E. Sandherr, the association's chief executive officer. "Congress and the administration should work together to expand career and technical education opportunities so more high school students will opt for good-paying careers in construction."
View the metro employment data by rank and state. View metro employment map.
Related Stories

Hotel Facilities | Jul 27, 2023
U.S. hotel construction pipeline remains steady with 5,572 projects in the works
The hotel construction pipeline grew incrementally in Q2 2023 as developers and franchise companies push through short-term challenges while envisioning long-term prospects, according to Lodging Econometrics.

Hotel Facilities | Jul 26, 2023
Hospitality building construction costs for 2023
Data from Gordian breaks down the average cost per square foot for 15-story hotels, restaurants, fast food restaurants, and movie theaters across 10 U.S. cities: Boston, Chicago, Las Vegas, Los Angeles, Miami, New Orleans, New York, Phoenix, Seattle, and Washington, D.C.

Market Data | Jul 24, 2023
Leading economists call for 2% increase in building construction spending in 2024
Following a 19.7% surge in spending for commercial, institutional, and industrial buildings in 2023, leading construction industry economists expect spending growth to come back to earth in 2024, according to the July 2023 AIA Consensus Construction Forecast Panel.

Contractors | Jul 13, 2023
Construction input prices remain unchanged in June, inflation slowing
Construction input prices remained unchanged in June compared to the previous month, according to an Associated Builders and Contractors analysis of U.S. Bureau of Labor Statistics Producer Price Index data released today. Nonresidential construction input prices were also unchanged for the month.

Contractors | Jul 11, 2023
The average U.S. contractor has 8.9 months worth of construction work in the pipeline, as of June 2023
Associated Builders and Contractors reported that its Construction Backlog Indicator remained unchanged at 8.9 months in June 2023, according to an ABC member survey conducted June 20 to July 5. The reading is unchanged from June 2022.

Market Data | Jul 5, 2023
Nonresidential construction spending decreased in May, its first drop in nearly a year
National nonresidential construction spending decreased 0.2% in May, according to an Associated Builders and Contractors analysis of data published today by the U.S. Census Bureau. On a seasonally adjusted annualized basis, nonresidential spending totaled $1.06 trillion.

Apartments | Jun 27, 2023
Average U.S. apartment rent reached all-time high in May, at $1,716
Multifamily rents continued to increase through the first half of 2023, despite challenges for the sector and continuing economic uncertainty. But job growth has remained robust and new households keep forming, creating apartment demand and ongoing rent growth. The average U.S. apartment rent reached an all-time high of $1,716 in May.

Industry Research | Jun 15, 2023
Exurbs and emerging suburbs having fastest population growth, says Cushman & Wakefield
Recently released county and metro-level population growth data by the U.S. Census Bureau shows that the fastest growing areas are found in exurbs and emerging suburbs.

Contractors | Jun 13, 2023
The average U.S. contractor has 8.9 months worth of construction work in the pipeline, as of May 2023
Associated Builders and Contractors reported that its Construction Backlog Indicator remained unchanged at 8.9 months in May, according to an ABC member survey conducted May 20 to June 7. The reading is 0.1 months lower than in May 2022. Backlog in the infrastructure category ticked up again and has now returned to May 2022 levels. On a regional basis, backlog increased in every region but the Northeast.

Industry Research | Jun 13, 2023
Two new surveys track how the construction industry, in the U.S. and globally, is navigating market disruption and volatility
The surveys, conducted by XYZ Reality and KPMG International, found greater willingness to embrace technology, workplace diversity, and ESG precepts.


