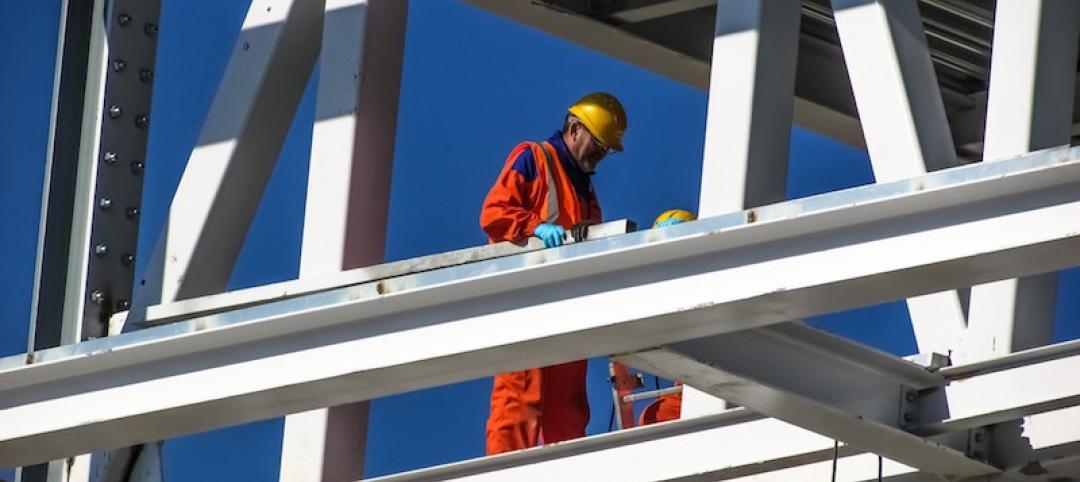
Construction employment grew in 211, or 59%, out of 358 metro areas between December 2018 and December 2019, declined in 73 and was unchanged in 74, according to a new analysis of federal employment data released today by the Associated General Contractors of America. Association officials said that many firms report they are having a hard time finding enough qualified workers to hire, which likely undermined employment gains in some parts of the country.
“There are not enough qualified workers in many parts of the country for firms to be able to keep pace with strong demand for work,” said Ken Simonson, the association’s chief economist. “Construction workforce shortages appear to be holding back further job gains in many parts of the country.”
The Dallas-Plano-Irving, Texas metro area added the most construction jobs in 2019 (16,700 jobs, 11%). Other metro areas adding a large amount of construction jobs during the past 12 months include Los Angeles-Long Beach-Glendale, Calif. (12,300 jobs, 8%); Las Vegas-Henderson-Paradise, Nev. (9,400 jobs, 14%); Houston-The Woodlands-Sugar Land, Texas (9,300 jobs, 4%) and San Diego-Carlsbad, Calif. (8,600 jobs, 10%). The largest percentage gain occurred in Kansas City, Mo. (17%, 4,800 jobs), followed by Omaha-Council Bluffs, Neb.-Iowa (16%, 4,500 jobs); Auburn-Opelika, Ala. (15 percent, 400 jobs) and Rochester, N.Y. (15 percent, 3,000 jobs). Construction employment reached a new December high in 71 metro areas and a new December low in four areas.
The largest job losses between December 2018 and December 2019 occurred in New York City (-4,500 jobs, -3%), followed by Northern Virginia (-2,900 jobs, -4%); Riverside-San Bernardino-Ontario, Calif. (-2,600 jobs -3%) and Cincinnati, Ohio-Ky. (-2,400 jobs, -5%). The largest percentage decrease took place in Fairbanks, Alaska (-12%, -300 jobs), followed by Longview, Texas (-10%, -1,400 jobs); Wichita Falls, Texas (-10%, -300 jobs); Victoria, Texas (-9%, -400 jobs) and Huntington-Ashland, W.Va.-Ky.-Ohio (-9%, -700 jobs).
Association officials said workforce shortages were undermining strong employment gains in many parts of the country and urged federal officials to take steps to encourage more people to pursue high-paying construction careers. These steps include doubling federal investments in career and technical education to expose more students to construction career opportunities. And they called on Washington officials to establish a temporary work visa program to allow people with construction skills to work in markets impacted by labor shortages.
“Given the current state of demand for their services, many construction firms would be hiring more workers if only they could find them,” said Stephen E. Sandherr, the association’s chief executive officer. “Instead of convincing young adults to go into debt to pay for college, Congress and the administration should expose them to other options, including high-paying construction careers.”
View the metro employment data, rankings, top 10, history and map.
Related Stories
Industry Research | Aug 11, 2017
NCARB releases latest data on architectural education, licensure, and diversity
On average, becoming an architect takes 12.5 years—from the time a student enrolls in school to the moment they receive a license.
Market Data | Aug 4, 2017
U.S. grand total construction starts growth projection revised slightly downward
ConstructConnect’s quarterly report shows courthouses and sports stadiums to end 2017 with a flourish.
Market Data | Aug 2, 2017
Nonresidential Construction Spending falls in June, driven by public sector
June’s weak construction spending report can be largely attributed to the public sector.
Market Data | Jul 31, 2017
U.S. economic growth accelerates in second quarter; Nonresidential fixed investment maintains momentum
Nonresidential fixed investment, a category of GDP embodying nonresidential construction activity, expanded at a 5.2% seasonally adjusted annual rate.
Multifamily Housing | Jul 27, 2017
Apartment market index: Business conditions soften, but still solid
Despite some softness at the high end of the apartment market, demand for apartments will continue to be substantial for years to come, according to the National Multifamily Housing Council.
Market Data | Jul 25, 2017
What's your employer value proposition?
Hiring and retaining talent is one of the top challenges faced by most professional services firms.
Market Data | Jul 25, 2017
Moderating economic growth triggers construction forecast downgrade for 2017 and 2018
Prospects for the construction industry have weakened with developments over the first half of the year.
Industry Research | Jul 6, 2017
The four types of strategic real estate amenities
From swimming pools to pirate ships, amenities (even crazy ones) aren’t just perks, but assets to enhance performance.
Market Data | Jun 29, 2017
Silicon Valley, Long Island among the priciest places for office fitouts
Coming out on top as the most expensive market to build out an office is Silicon Valley, Calif., with an out-of-pocket cost of $199.22.
Market Data | Jun 26, 2017
Construction disputes were slightly less contentious last year
But poorly written and administered contracts are still problems, says latest Arcadis report.


