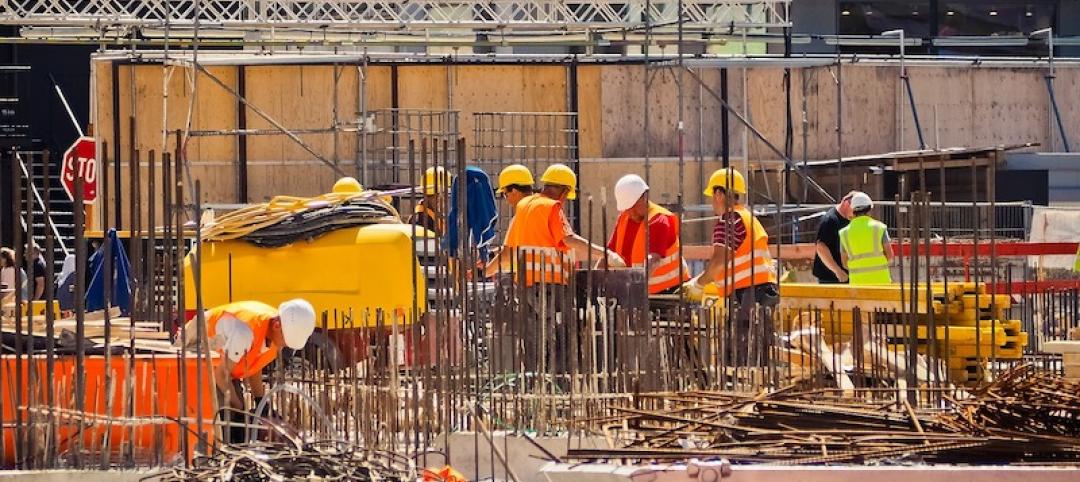
Construction employment decreased from February 2020 – the last month prior to the pandemic – to April 2021 in 107, or 30%, of the nation’s metro areas, and was stagnant in another 34, according to an analysis by the Associated General Contractors of America of government employment data released today. Association officials said that construction employment in many parts of the country was being undermined by pandemic-induced project delays, materials price spikes and shortages, and difficulties finding labor.
“It is disturbing to see that nearly one-third of the nation’s metro areas had lower construction employment totals in the mild weather and strongly rebounding economy of April 2021 than in the winter of 2020,” said Ken Simonson, the association’s chief economist. “Ever-growing supply-chain bottlenecks and record prices for numerous construction materials threaten to further chill demand for job gains in many metros.”
Houston-The Woodlands-Sugar Land, Texas lost the largest number of construction jobs over the 14-month period (-29,300 jobs, -12%), followed by New York City (-22,300 jobs, -14%); Midland, Texas (-9,800 jobs, -26%); Odessa, Texas (-8,000 jobs, -39%); and Lake Charles, La. (7,200 jobs, -36%). Odessa had the largest percentage decline, followed by Lake Charles; Midland; Laredo, Texas (-23%, -7,200 jobs) and Longview, Texas (-23%, -3,400 jobs).
Construction employment was stagnant in 34 additional metro areas, while 217 metro areas—61%—added construction jobs over the pre-pandemic (February 2020) level. Indianapolis-Carmel-Anderson, Ind. added the most construction jobs over 14 months (7,900 jobs, 15%), followed by Chicago-Naperville-Arlington Heights, Ill. (6,300 jobs, 5%); Seattle-Bellevue-Everett, Wash. (6,200 jobs, 6%); Minneapolis-St. Paul-Bloomington, Minn.-Wis. (5,900 jobs, 8%); and Sacramento--Roseville--Arden-
Sierra Vista-Douglas, Ariz. had the highest percentage increase (44%, 1,100 jobs), followed by Fargo, N.D.-Minn. (34%, 2,500 jobs); Lawrence-Methuen Town Salem, Mass-N.H. (29%, 1,000 jobs); Bay City, Mich. (27%, 300 jobs) and Taunton-Middleborough-Norton, Mass. (22%, 700 jobs).
Association officials called on the Biden administration to take steps to address rising materials prices and growing labor shortages. These steps include removing tariffs on key construction materials like steel, lumber and aluminum. And they include ending unemployment insurance supplements that are providing incentives for qualified workers to stay off payrolls for now.
“Washington has put in place a number of artificial barriers that are holding back the construction industry’s recovery,” said Stephen E. Sandherr, the association’s chief executive officer. “Washington’s tariffs are making materials more expensive while its unemployment supplements are making workers more hesitant to return to payrolls.”
View the metro employment 14-month data, rankings, top 10, multi-division metros, and map.
Related Stories
Market Data | Sep 22, 2016
Architecture Billings Index slips, overall outlook remains positive
Business conditions are slumping in the Northeast.
Market Data | Sep 20, 2016
Backlog skyrockets for largest firms during second quarter, but falls to 8.5 months overall
While a handful of commercial construction segments continue to be associated with expanding volumes, for the most part, the average contractor is no longer getting busier, says ABC Chief Economist Anirban Basu.
Designers | Sep 13, 2016
5 trends propelling a new era of food halls
Food halls have not only become an economical solution for restauranteurs and chefs experiencing skyrocketing retail prices and rents in large cities, but they also tap into our increased interest in gourmet locally sourced food, writes Gensler's Toshi Kasai.
Building Team | Sep 6, 2016
Letting your resource take center stage: A guide to thoughtful site selection for interpretive centers
Thoughtful site selection is never about one factor, but rather a confluence of several components that ultimately present trade-offs for the owner.
Market Data | Sep 2, 2016
Nonresidential spending inches lower in July while June data is upwardly revised to eight-year record
Nonresidential construction spending has been suppressed over the last year or so with the primary factor being the lack of momentum in public spending.
Industry Research | Sep 1, 2016
CannonDesign releases infographic to better help universities obtain more R&D funding
CannonDesign releases infographic to better help universities obtain more R&D funding.
Industry Research | Aug 25, 2016
Building bonds: The role of 'trusted advisor' is earned not acquired
A trusted advisor acts as a guiding partner over the full course of a professional relationship.
Multifamily Housing | Aug 17, 2016
A new research platform launches for a data-deprived multifamily sector
The list of leading developers, owners, and property managers that are funding the NMHC Research Foundation speaks to the information gap it hopes to fill.
Hotel Facilities | Aug 17, 2016
Hotel construction continues to flourish in major cities
But concerns about overbuilding persist.
Market Data | Aug 16, 2016
Leading economists predict construction industry growth through 2017
The Chief Economists for ABC, AIA, and NAHB all see the construction industry continuing to expand over the next year and a half.


