


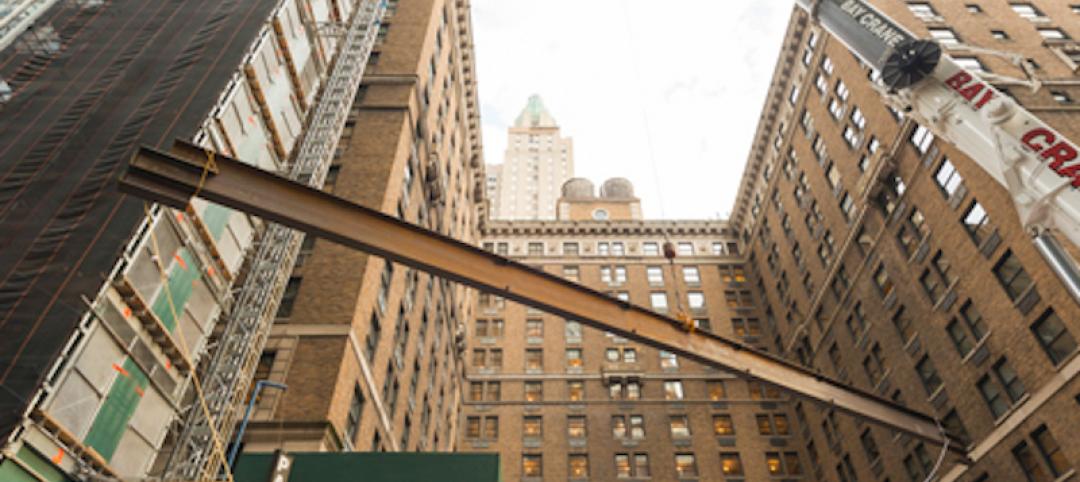
Toronto, Seattle, Los Angeles, and Denver top the list of U.S/Canadian cities with the greatest number of fixed construction cranes on construction sites, according to Rider Levett Bucknall's RLB Crane Index for North America for Q1 2023.
Toronto had a whopping 238 cranes in place in the first quarter. Seattle had 51 cranes to lead all U.S. cities, followed by Los Angeles (47), Denver (36), and Washington, D.C. (26).
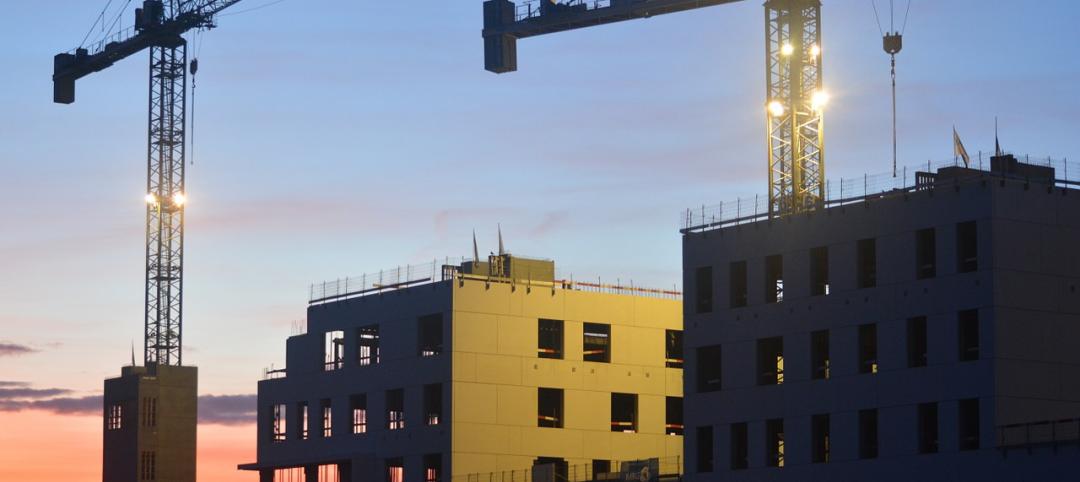
The RLB survey reports a nominal increase of 7.04% (34 cranes) from the Q3 2022 edition of the RLB Crane Index. Of the 14 cities surveyed, eight experienced
an increase in cranes, two decreased, and four held steady.
The three top sectors across all cities are residential (51%), mixed use (22%), and commercial (12%).
"Despite continued workforce challenges and economic uncertainties are still concerns for the coming year, we are continuing to see new projects break ground within our 14-key markets. This indicates that investments are continuing to be made into our cities," said the report's authors.
"Notwithstanding concerns for the housing market, residential and mixed-use projects make up 73% of the overall count. We anticipate the number of cranes to remain high into 2023. Despite uncertain market conditions, construction projects will continue to break ground, albeit at a cost," the added.
About the RLB Crane Index
Rider Levett Bucknall’s Crane Index for North America is published biannually. It tracks the number of operating tower cranes in 14 major cities across the U.S. and Canada. The index was the first of its kind, and unlike other industry barometers that track cost and other financial data, the Crane Index tracks the number of fixed cranes on construction sites and gives a simplified measure of the current state of the construction industry’s workload in each location.
Related Stories
Market Data | Feb 10, 2016
Nonresidential building starts and spending should see solid gains in 2016: Gilbane report
But finding skilled workers continues to be a problem and could inflate a project's costs.

Market Data | Feb 9, 2016
Cushman & Wakefield is bullish on U.S. economy and its property markets
Sees positive signs for construction and investment growth in warehouses, offices, and retail
Market Data | Feb 5, 2016
CMD/Oxford forecast: Nonresidential building growth will recover modestly in 2016
Increased government spending on infrastructure projects should help.

Market Data | Feb 4, 2016
Mortenson: Nonresidential construction costs expected to increase in six major metros
The Construction Cost Index, from Mortenson Construction, indicated rises between 3 and 4% on average.

Contractors | Feb 1, 2016
ABC: Tepid GDP growth a sign construction spending may sputter
Though the economy did not have a strong ending to 2015, the data does not suggest that nonresidential construction spending is set to decline.

Data Centers | Jan 28, 2016
Top 10 markets for data center construction
JLL’s latest outlook foresees a maturation in certain metros.

Market Data | Jan 20, 2016
Nonresidential building starts sag in 2015
CDM Research finds only a few positive signs among the leading sectors.
Market Data | Jan 20, 2016
Architecture Billings Index ends year on positive note
While volatility persists, architecture firms reported healthy performance for 2015.

Market Data | Jan 15, 2016
ABC: Construction material prices continue free fall in December
In December, construction material prices fell for the sixth consecutive month. Prices have declined 7.2% since peaking in August 2014.

Market Data | Jan 13, 2016
Morgan Stanley bucks gloom and doom, thinks U.S. economy has legs through 2020
Strong job growth and dwindling consumer debt give rise to hope.


