


Through April of this year, the national average increase in construction cost was 4.48%, annualized. Construction put in place during April 2019, at a seasonally adjusted annualized rate of $1.299 trillion, was 1.2% below construction put in place in April 2018.
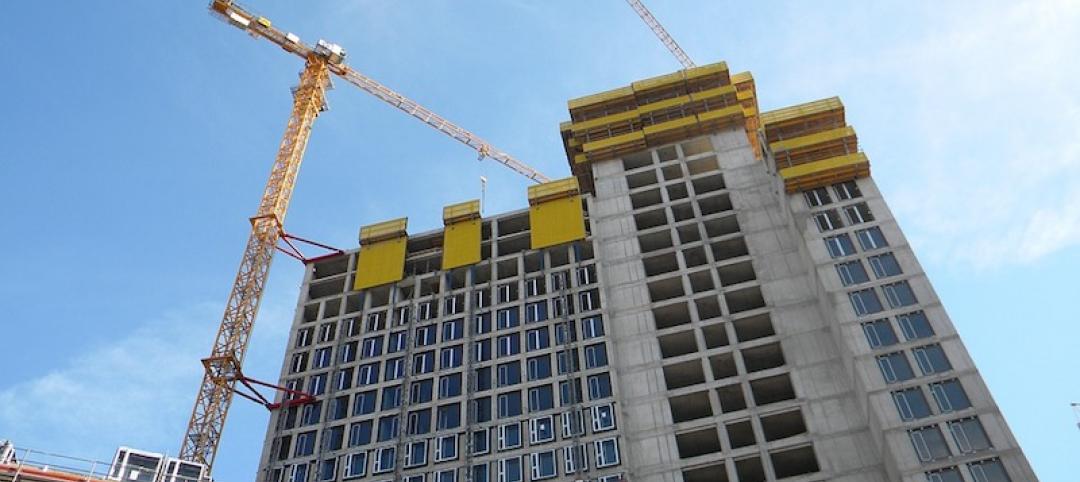
In its just-released second quarter Construction Cost Report for North America, which is based on data from a dozen U.S. markets ansdn two Canadian markets, the construction management consultant Rider Levett Bucknall reiterates the financial and time impacts that the shortage of qualified trade workers is having on the construction industry’s productivity and expansion.
“Even as technology transforms the jobsite, improving both efficiency and worker safety, skilled-labor recruitment and retention are essential to the future of construction,” writes Julian Anderson, FRICS, Rider Levett Bucknall’s President-North America. “As worker shortage makes projects more costly and slower to build, the risk of undermining broader economic growth increases.”
RLB’s National Construction Cost Index stood at 200.55 in the second quarter of 2019, up from 189.8 in the same quarter a year earlier, and 182.16 in Q2 2017. Keep in mind that these increases are occurring at a time when there has been relatively little inflation in the economy.

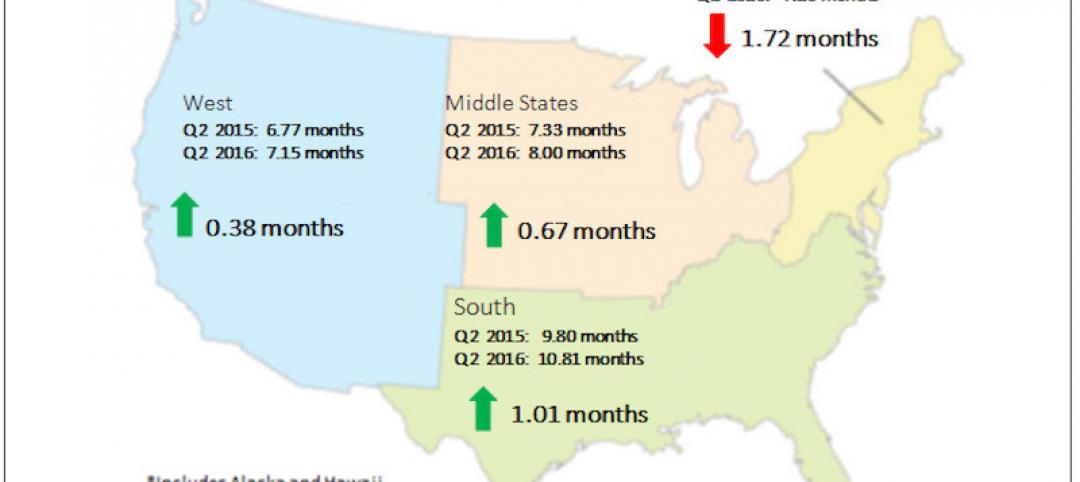
The construction backlog in North America was more than nine months in the second quarter. Image: Rider Levett Bucknall, from Associated Builders and Contractors estimates.
RLB's estimates are in line Turner Construction's quarterly Building Cost Index (https://bit.ly/2xWrf61), which the GC giant released on July 16. That Index, at 1149, was up 1.23% over the first quarter, and 5.51% over the second quarter of 2018. “Contractors continue to be selective due to the availability of skilled labor,” wrote Attilio Rivetti, Turner's vice president responsible for compiling its cost index.
To further make its case, RLB cites the Associated Builders and Contractors’ Construction Backlog Indicator, which reflects the amount of work that will be performed by commercial and industrial contractors in the months ahead. The backlog for 2018 averaged 9.15 months, slightly below the 2017 average but still up 17% from 2011.
The report breaks down current building costs by market and by seven typologies: offices, retail, hotels, hospitals, warehouses, parking, and residential. For example, Las Vegas, Phoenix, Portland, Seattle, and Denver continue to be relative bargains for office construction, based on their costs per sf. Los Angeles, Washington DC, and New York are the high-priced spreads when building hospitals. As for hotel construction, Honolulu and San Francisco are priciest.
Overall, Chicago experienced the greatest increase in construction bid costs (including materials, labor, and fees), 8.77%, between April 2018 and April 2019, followed San Francisco (7.05%), Portland (6.82%), Seattle (6.68%), Phoenix (6.47%), and Honolulu (5.83%), all above the national average increase.
Los Angeles, while no slouch on the construction front, was the only metro that RLB tracks that experienced a decrease in construction costs in the second quarter, down 1.22%.

Chicago experienced the highest percentage increase in quarterly construction costs. Image: Rider Levett Bucknall
Through the first quarter of 2019, construction unemployment remained steady at 5.2%. The vast majority of construction firms are still having trouble filling open positions. And this situation could worsen, according to the Associated General Contractors of America, as a result of the Trump Administration’s proposal, announced last month, which would exclude the construction sector from the Labor Department’s apprenticeship framework. (Currently, more than three quarters of the federally administered apprenticeships in the U.S. are either in construction or part of military training, notes RLB.)
In a separate report that gauges construction activity by the number of cranes in use in North America, RLB’s July survey marked the fourth consecutive increase. However, only two of 11 U.S. markets tracked—Los Angeles and Denver—saw an increase in cranes. Five other cities were steady.
Cranes for commercial projects were up nationally and accounted for 41% of the cranes in use in New York City. In all markets, mixed-use and multifamily residential construction accounted for 67% of the cranes counted. In Seattle alone, mixed use and residential required 78% of cranes used.
Related Stories

Industry Research | Oct 25, 2016
New HOK/CoreNet Global report explores impact of coworking on corporate real rstate
“Although coworking space makes up less than one percent of the world’s office space, it represents an important workforce trend and highlights the strong desire of today’s employees to have workplace choices, community and flexibility,” says Kay Sargent, Director of WorkPlace at HOK.

Market Data | Oct 24, 2016
New construction starts in 2017 to increase 5% to $713 billion
Dodge Outlook Report predicts moderate growth for most project types – single family housing, commercial and institutional building, and public works, while multifamily housing levels off and electric utilities/gas plants decline.

High-rise Construction | Oct 21, 2016
The world’s 100 tallest buildings: Which architects have designed the most?
Two firms stand well above the others when it comes to the number of tall buildings they have designed.

Market Data | Oct 19, 2016
Architecture Billings Index slips consecutive months for first time since 2012
“This recent backslide should act as a warning signal,” said AIA Chief Economist, Kermit Baker.

Market Data | Oct 11, 2016
Building design revenue topped $28 billion in 2015
Growing profitability at architecture firms has led to reinvestment and expansion

Market Data | Oct 4, 2016
Nonresidential spending slips in August
Public sector spending is declining faster than the private sector.

Industry Research | Oct 3, 2016
Structure Tone survey shows cost is still a major barrier to building green
Climate change, resilience and wellness are also growing concerns.
Industry Research | Sep 27, 2016
Sterling Risk Sentiment Index indicates risk exposure perception remains stable in construction industry
Nearly half (45%) of those polled say election year uncertainty has a negative effect on risk perception in the construction market.
Market Data | Sep 22, 2016
Architecture Billings Index slips, overall outlook remains positive
Business conditions are slumping in the Northeast.
Market Data | Sep 20, 2016
Backlog skyrockets for largest firms during second quarter, but falls to 8.5 months overall
While a handful of commercial construction segments continue to be associated with expanding volumes, for the most part, the average contractor is no longer getting busier, says ABC Chief Economist Anirban Basu.


