


Through April of this year, the national average increase in construction cost was 4.48%, annualized. Construction put in place during April 2019, at a seasonally adjusted annualized rate of $1.299 trillion, was 1.2% below construction put in place in April 2018.
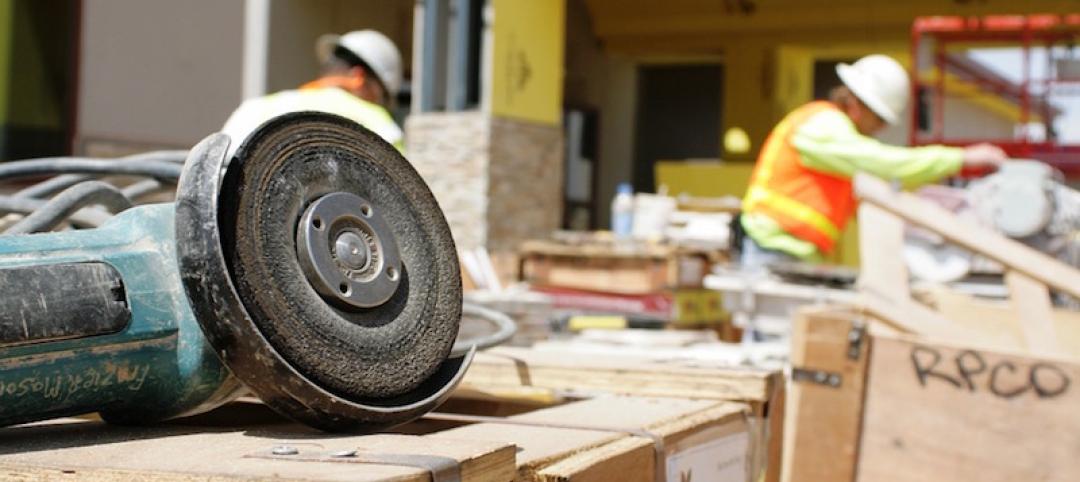
In its just-released second quarter Construction Cost Report for North America, which is based on data from a dozen U.S. markets ansdn two Canadian markets, the construction management consultant Rider Levett Bucknall reiterates the financial and time impacts that the shortage of qualified trade workers is having on the construction industry’s productivity and expansion.
“Even as technology transforms the jobsite, improving both efficiency and worker safety, skilled-labor recruitment and retention are essential to the future of construction,” writes Julian Anderson, FRICS, Rider Levett Bucknall’s President-North America. “As worker shortage makes projects more costly and slower to build, the risk of undermining broader economic growth increases.”
RLB’s National Construction Cost Index stood at 200.55 in the second quarter of 2019, up from 189.8 in the same quarter a year earlier, and 182.16 in Q2 2017. Keep in mind that these increases are occurring at a time when there has been relatively little inflation in the economy.

The construction backlog in North America was more than nine months in the second quarter. Image: Rider Levett Bucknall, from Associated Builders and Contractors estimates.
RLB's estimates are in line Turner Construction's quarterly Building Cost Index (https://bit.ly/2xWrf61), which the GC giant released on July 16. That Index, at 1149, was up 1.23% over the first quarter, and 5.51% over the second quarter of 2018. “Contractors continue to be selective due to the availability of skilled labor,” wrote Attilio Rivetti, Turner's vice president responsible for compiling its cost index.
To further make its case, RLB cites the Associated Builders and Contractors’ Construction Backlog Indicator, which reflects the amount of work that will be performed by commercial and industrial contractors in the months ahead. The backlog for 2018 averaged 9.15 months, slightly below the 2017 average but still up 17% from 2011.
The report breaks down current building costs by market and by seven typologies: offices, retail, hotels, hospitals, warehouses, parking, and residential. For example, Las Vegas, Phoenix, Portland, Seattle, and Denver continue to be relative bargains for office construction, based on their costs per sf. Los Angeles, Washington DC, and New York are the high-priced spreads when building hospitals. As for hotel construction, Honolulu and San Francisco are priciest.
Overall, Chicago experienced the greatest increase in construction bid costs (including materials, labor, and fees), 8.77%, between April 2018 and April 2019, followed San Francisco (7.05%), Portland (6.82%), Seattle (6.68%), Phoenix (6.47%), and Honolulu (5.83%), all above the national average increase.
Los Angeles, while no slouch on the construction front, was the only metro that RLB tracks that experienced a decrease in construction costs in the second quarter, down 1.22%.

Chicago experienced the highest percentage increase in quarterly construction costs. Image: Rider Levett Bucknall
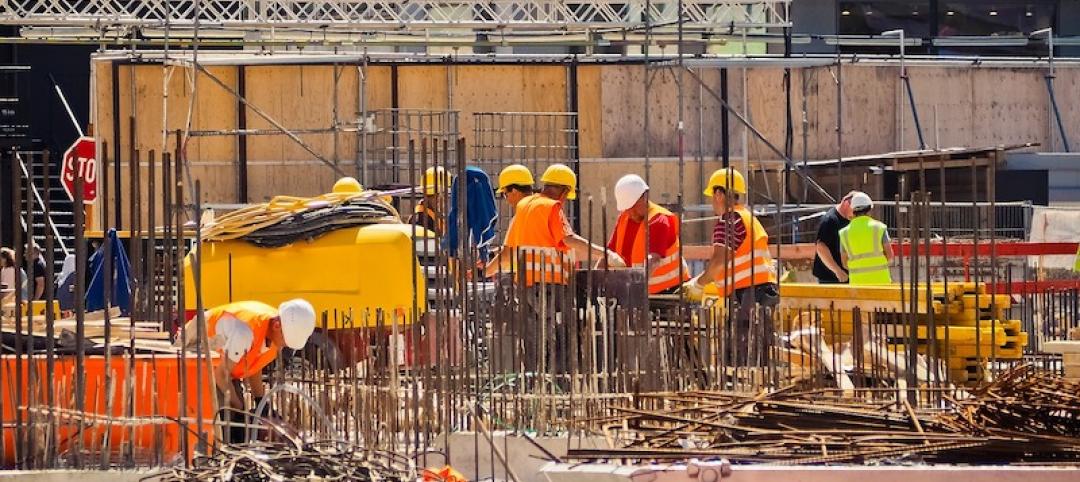
Through the first quarter of 2019, construction unemployment remained steady at 5.2%. The vast majority of construction firms are still having trouble filling open positions. And this situation could worsen, according to the Associated General Contractors of America, as a result of the Trump Administration’s proposal, announced last month, which would exclude the construction sector from the Labor Department’s apprenticeship framework. (Currently, more than three quarters of the federally administered apprenticeships in the U.S. are either in construction or part of military training, notes RLB.)
In a separate report that gauges construction activity by the number of cranes in use in North America, RLB’s July survey marked the fourth consecutive increase. However, only two of 11 U.S. markets tracked—Los Angeles and Denver—saw an increase in cranes. Five other cities were steady.
Cranes for commercial projects were up nationally and accounted for 41% of the cranes in use in New York City. In all markets, mixed-use and multifamily residential construction accounted for 67% of the cranes counted. In Seattle alone, mixed use and residential required 78% of cranes used.
Related Stories

Market Data | Jan 18, 2017
Architecture Billings Index ends year on positive note
Architecture firms close 2016 with the strongest performance of the year.
Market Data | Jan 12, 2017
73% of construction firms plan to expand their payrolls in 2017
However, many firms remain worried about the availability of qualified workers.

Market Data | Jan 9, 2017
Trump market impact prompts surge in optimism for U.S. engineering firm leaders
The boost in firm leader optimism extends across almost the entire engineering marketplace.
Market Data | Jan 5, 2017
Nonresidential spending thrives in strong November spending report
Many construction firms have reported that they remain busy but have become concerned that work could dry up in certain markets in 2017 or 2018, says Anirban Basu, ABC Chief Economist.

Market Data | Dec 21, 2016
Architecture Billings Index up slightly in November
New design contracts also return to positive levels, signifying future growth in construction activity.
Market Data | Dec 21, 2016
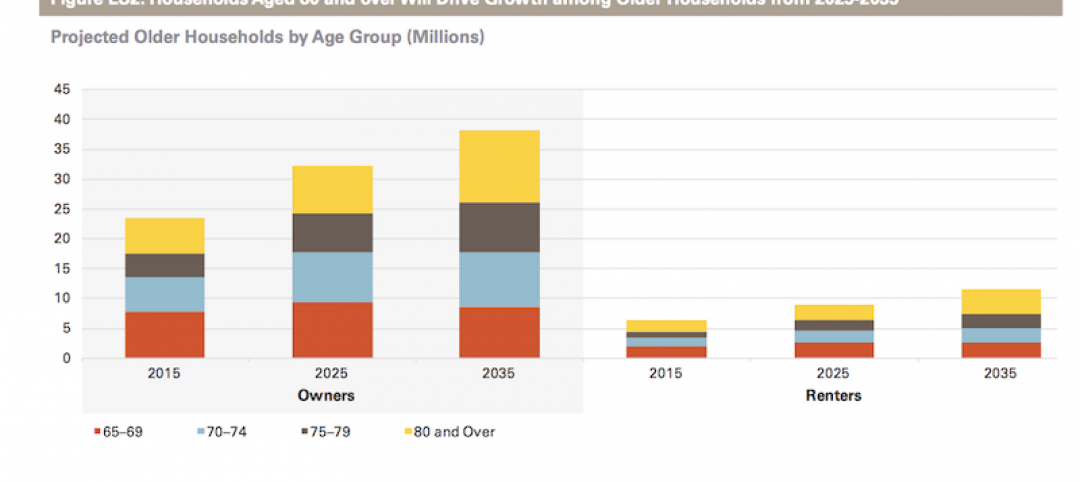
Will housing adjust to an aging population?
New Joint Center report projects 66% increase in senior heads of households by 2035.
Market Data | Dec 13, 2016
ABC predicts modest growth for 2017 nonresidential construction sector; warns of vulnerability for contractor
“The U.S. economy continues to expand amid a weak global economy and, despite risks to the construction industry, nonresidential spending should expand 3.5 percent in 2017,” says ABC Chief Economist Anirban Basu.
Market Data | Dec 2, 2016
Nonresidential construction spending gains momentum
Nonresidential spending is now 2.6 percent higher than at the same time one year ago.

Market Data | Nov 30, 2016
Marcum Commercial Construction Index reports industry outlook has shifted; more change expected
Overall nonresidential construction spending in September totaled $690.5 billion, down a slight 0.7 percent from a year earlier.

Industry Research | Nov 30, 2016
Multifamily millennials: Here is what millennial renters want in 2017
It’s all about technology and convenience when it comes to the things millennial renters value most in a multifamily facility.


