

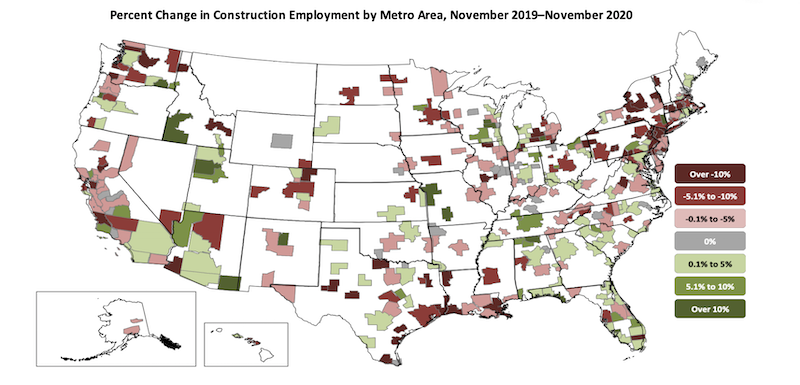
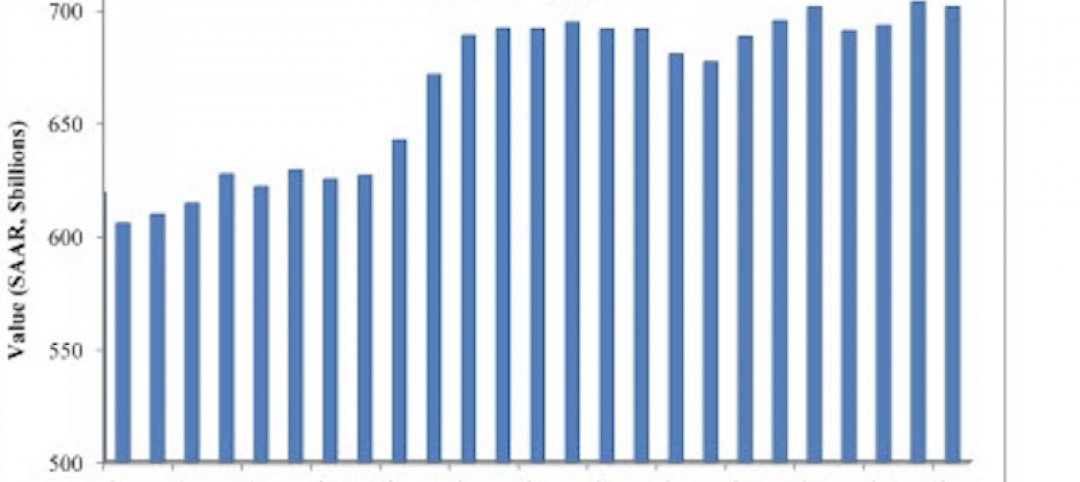
Only 34% of the nation’s metro areas—just over one-third—added construction jobs from November 2019 to November 2020, according to an analysis of new government data that the Associated General Contractors of America released today. Association officials said large numbers of contractors are having to lay off workers once they complete projects begun before the pandemic because private owners and public agencies are hesitant to commit to new construction.
“Canceled and postponed projects appear to be more common than new starts for far too many contractors,” said Ken Simonson, the association’s chief economist. “Our association’s 2021 Construction Hiring and Business Outlook Survey found three times more contractors have experienced postponements and cancellations than new or expanded projects.”
Construction employment fell in 203, or 57%, of 358 metro areas between November 2019 and November 2020. Construction employment was stagnant in 33 additional metro areas, while only 122 metro areas—34%—added construction jobs during the past year.
Houston-The Woodlands-Sugar Land, Texas lost the most construction jobs over that span (-22,500 jobs, -9%), followed by New York City (-16,700 jobs, -11%); Midland, Texas (-9,800 jobs, -25%); Montgomery-Bucks-Chester counties, Pa. (-8,800 jobs, -16%); and Oakland-Hayward-Berkeley, Calif. (-8,400 jobs, -11%). Brockton-Bridgewater-Easton, Mass. had the largest percentage decline (-40%, -2,200 jobs), followed by Altoona, Pa. (-35%, -1,100 jobs); Bloomsburg-Berwick, Pa. (-31%, -400 jobs); Johnstown, Pa. (-31%, -800 jobs); and East Stroudsburg, Pa. (-30%, -600 jobs).
Phoenix-Mesa-Scottsdale, Ariz. added the most construction jobs over the year (4,700 jobs, 3%), followed by Baltimore-Columbia-Towson, Md. (4,500 jobs, 5%); Boise, Idaho (4,300 jobs, 16%); Dallas-Plano-Irving, Texas (3,700 jobs, 2%); and Seattle-Bellevue-Everett, Wash. (3,600 jobs, 3%). Walla Walla, Wash. had the highest percentage increase (17%, 200 jobs), followed by Boise; Oshkosh-Neenah, Wisc. (16%, 900 jobs); and Springfield, Mo. (16%, 1,500 jobs).
Association officials said many metro areas were likely to lose more construction jobs amid declining demand and continued project cancellations and delays. They added that a clearer picture of what is in store for the industry will emerge on Thursday, January 7, when the association releases the 2021 Construction Hiring and Business Outlook it prepared with Sage.
“Construction employment is likely to fall further in many parts of the country as the coronavirus continues to weigh on demand for nonresidential projects,” said Stephen E. Sandherr, the association’s chief executive officer. “Unless market conditions change rapidly, this year is likely to prove very challenging for many construction employers.”
View the metro employment 12-month data, rankings, top 10, new highs and lows, map.
Related Stories

Market Data | Sep 22, 2016
Architecture Billings Index slips, overall outlook remains positive
Business conditions are slumping in the Northeast.
Market Data | Sep 20, 2016
Backlog skyrockets for largest firms during second quarter, but falls to 8.5 months overall
While a handful of commercial construction segments continue to be associated with expanding volumes, for the most part, the average contractor is no longer getting busier, says ABC Chief Economist Anirban Basu.
Designers | Sep 13, 2016
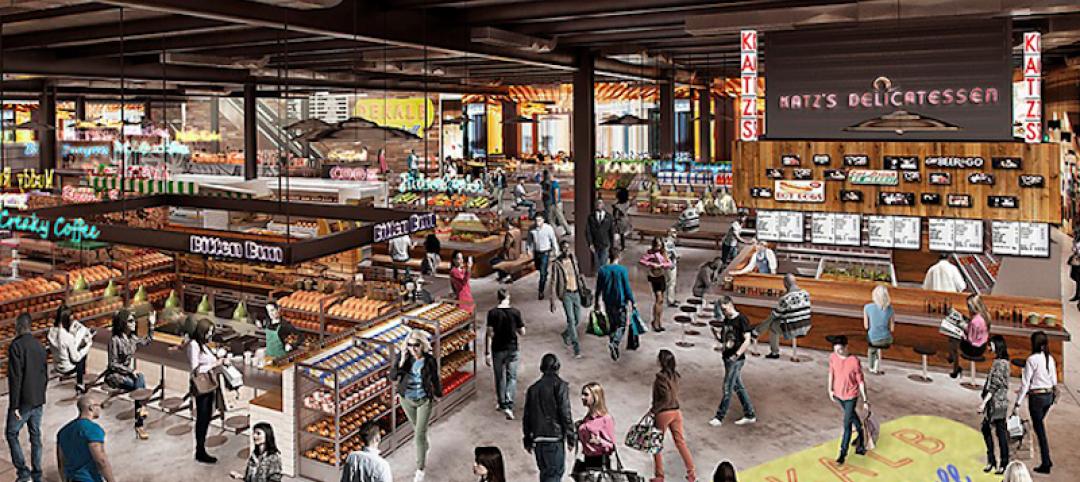
5 trends propelling a new era of food halls
Food halls have not only become an economical solution for restauranteurs and chefs experiencing skyrocketing retail prices and rents in large cities, but they also tap into our increased interest in gourmet locally sourced food, writes Gensler's Toshi Kasai.
Building Team | Sep 6, 2016
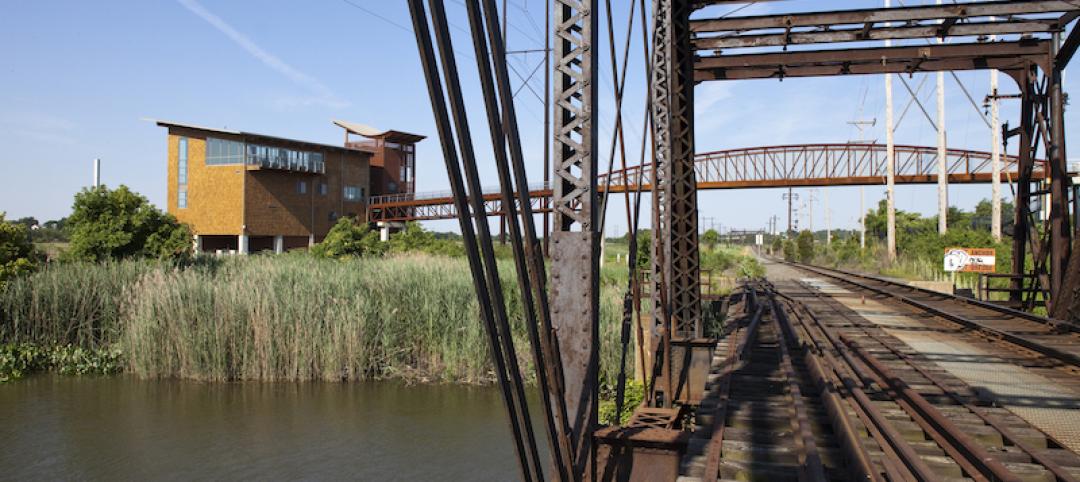
Letting your resource take center stage: A guide to thoughtful site selection for interpretive centers
Thoughtful site selection is never about one factor, but rather a confluence of several components that ultimately present trade-offs for the owner.
Market Data | Sep 2, 2016
Nonresidential spending inches lower in July while June data is upwardly revised to eight-year record
Nonresidential construction spending has been suppressed over the last year or so with the primary factor being the lack of momentum in public spending.

Industry Research | Sep 1, 2016
CannonDesign releases infographic to better help universities obtain more R&D funding
CannonDesign releases infographic to better help universities obtain more R&D funding.

Industry Research | Aug 25, 2016
Building bonds: The role of 'trusted advisor' is earned not acquired
A trusted advisor acts as a guiding partner over the full course of a professional relationship.
Multifamily Housing | Aug 17, 2016
A new research platform launches for a data-deprived multifamily sector
The list of leading developers, owners, and property managers that are funding the NMHC Research Foundation speaks to the information gap it hopes to fill.
Hotel Facilities | Aug 17, 2016
Hotel construction continues to flourish in major cities
But concerns about overbuilding persist.
Market Data | Aug 16, 2016
Leading economists predict construction industry growth through 2017
The Chief Economists for ABC, AIA, and NAHB all see the construction industry continuing to expand over the next year and a half.


