Nonresidential construction spending dipped in February, falling 1.4% on a monthly basis according to analysis of U.S. Census Bureau data released by Associated Builders and Contractors (ABC).
Spending in the nonresidential sector totaled $690.3 billion on a seasonally adjusted, annualized basis in February. While this represents a step back from January's figure of $700.3 billion (revised down from $701.9 billion), it is still 1.5% higher than the level of spending registered in December 2015 and 10.1% higher than February 2015.
"February's weather was particularly harsh in certain parts of the country, including in the economic activity-rich Mid-Atlantic region, and that appears to have had an undue effect on construction spending data," ABC Chief Economist Anirban Basu said. "February data are always difficult to interpret, and the latest nonresidential construction spending figures are no different. Seasonal factors have also made state-level data very difficult to interpret.
"Beyond meteorological considerations, there are other reasons not to be alarmed by February's decline in nonresidential construction spending," Basu said. "Today's positive construction employment report indicates continued economic growth. Moreover, much of the decline in volume was attributable to manufacturing, but the ISM manufacturing index recently crossed the threshold 50 level, indicating that domestic manufacturing is now expanding for the first time in seven months."
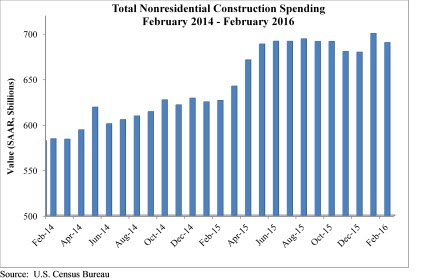
Eight of the 16 nonresidential subsectors experienced spending decreases in February, though almost half of the total decline in spending is attributable to the 5.9% decline in manufacturing-related spending.
The following 16 nonresidential construction sectors experienced spending increases in February on a monthly basis:
- Spending in the amusement and recreation category climbed 0.4% from January and is up 13.7% from February 2015.
- Lodging-related spending is up 0.4% for the month and is up 30.1% on a year-ago basis.
- Water supply-related spending expanded 1.9% on a monthly basis and 3.2% on a yearly basis.
- Spending in the office category grew 3.8% from January and is up 25.3% on a year-ago basis.
- Transportation-related spending expanded 0.5% month-over-month and 5.8% year-over-year.
- Health care-related spending expanded 2% from January and is up 3.3% from February 2015.
- Public safety-related spending is up 1.8% for the month, but is down 5.3% for the year.
- Commercial-related construction spending inched 0.1% higher for the month and grew 11% for the year.
Spending in eight of the nonresidential construction subsectors fell in February on a monthly basis:
- Educational-related construction spending fell 2.4% from January, but has expanded 8.5% on a yearly basis.
- Communication-related spending fell 15% month-over-month, but expanded 11.8% year-over-year.
- Spending in the highway and street category fell 2% from January, but is 24.5 higher than one year ago.
- Sewage and waste disposal-related spending fell 2.4% for the month, but is up 2.3% for the year.
- Conservation and development-related spending is 4.6% lower on a monthly basis and 16.8% lower on a year-over-year basis.
- Spending in the religious category fell 4% for the month and is up just 0.7% for the year.
- Manufacturing-related spending fell 5.9% on a monthly basis and is up only 0.8% on a yearly basis.
- Spending in the power category fell 0.6% from January, but is 4.8% higher than one year ago.
Related Stories
Industry Research | Jan 23, 2024
Leading economists forecast 4% growth in construction spending for nonresidential buildings in 2024
Spending on nonresidential buildings will see a modest 4% increase in 2024, after increasing by more than 20% last year according to The American Institute of Architects’ latest Consensus Construction Forecast. The pace will slow to just over 1% growth in 2025, a marked difference from the strong performance in 2023.
Construction Costs | Jan 22, 2024
Construction material prices continue to normalize despite ongoing challenges
Gordian’s most recent Quarterly Construction Cost Insights Report for Q4 2023 describes an industry still attempting to recover from the impact of COVID. This was complicated by inflation, weather, and geopolitical factors that resulted in widespread pricing adjustments throughout the construction materials industries.
Hotel Facilities | Jan 22, 2024
U.S. hotel construction is booming, with a record-high 5,964 projects in the pipeline
The hotel construction pipeline hit record project counts at Q4, with the addition of 260 projects and 21,287 rooms over last quarter, according to Lodging Econometrics.
Multifamily Housing | Jan 15, 2024
Multifamily rent growth rate unchanged at 0.3%
The National Multifamily Report by Yardi Matrix highlights the highs and lows of the multifamily market in 2023. Despite strong demand, rent growth remained unchanged at 0.3 percent.
Self-Storage Facilities | Jan 5, 2024
The state of self-storage in early 2024
As the housing market cools down, storage facilities suffer from lower occupancy and falling rates, according to the December 2023 Yardi Matrix National Self Storage Report.
Designers | Dec 25, 2023
Redefining the workplace is a central theme in Gensler’s latest Design Report
The firm identifies eight mega trends that mostly stress human connections.
Contractors | Dec 12, 2023
The average U.S. contractor has 8.5 months worth of construction work in the pipeline, as of November 2023
Associated Builders and Contractors reported today that its Construction Backlog Indicator inched up to 8.5 months in November from 8.4 months in October, according to an ABC member survey conducted Nov. 20 to Dec. 4. The reading is down 0.7 months from November 2022.
Market Data | Nov 27, 2023
Number of employees returning to the office varies significantly by city
While the return-to-the-office trend is felt across the country, the percentage of employees moving back to their offices varies significantly according to geography, according to Eptura’s Q3 Workplace Index.
Market Data | Nov 14, 2023
The average U.S. contractor has 8.4 months worth of construction work in the pipeline, as of September 2023
Associated Builders and Contractors reported that its Construction Backlog Indicator declined to 8.4 months in October from 9.0 months in September, according to an ABC member survey conducted from Oct. 19 to Nov. 2. The reading is down 0.4 months from October 2022. Backlog now stands at its lowest level since the first quarter of 2022.
Multifamily Housing | Nov 9, 2023
Multifamily project completions forecast to slow starting 2026
Yardi Matrix has released its Q4 2023 Multifamily Supply Forecast, emphasizing a short-term spike and plateau of new construction.


