

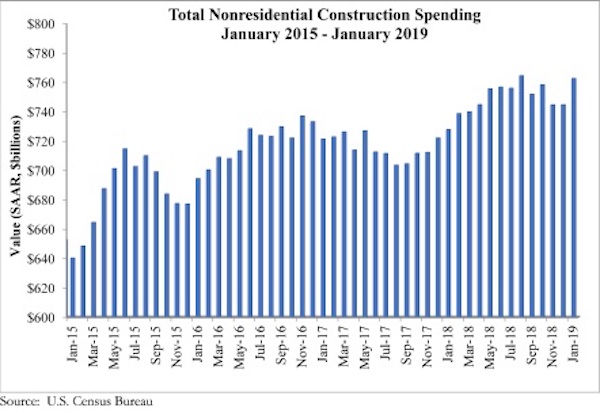
National nonresidential construction spending rose 2.4% in January, according to an Associated Builders and Contractors analysis of U.S. Census Bureau data released today. At a seasonally adjusted annualized rate, nonresidential spending totaled $762.5 billion for the month, an increase of 4.8% over the previous year. Public nonresidential construction spending expanded 4.9% in January and private spending increased 0.8%. Both public and private nonresidential spending are up 8.5% and 2.4%, respectively, on a yearly basis.
“An uptick in investment in certain infrastructure categories has been at the center of the ongoing nonresidential construction spending cycle,” said ABC Chief Economist Anirban Basu. “During the past year, construction spending has increased at rapid rates in conservation and development, highway and street, and transportation. While there has been much discussion about expanding infrastructure investment at the federal level, most of that investment has taken place at a state and local level, especially as government finances have improved in much of the nation, therefore supplying more support for infrastructure outlays. Significant job growth also has helped bolster income tax collections while rising real estate values have triggered improved property tax collections.
“Meanwhile, still reasonably strong consumer spending has helped support growing construction in segments like lodging,” said Basu. “Construction of data and fulfillment centers also has created demand for nonresidential construction services. The recent moderation in construction materials price increases has helped support construction starts because more developers and their financiers are concluding that new projects make business sense.
“While there has been some reduction in business and consumer confidence, the nonresidential construction spending cycle remains firmly in place for now,” said Basu. “Despite the recent dip in ABC’s Construction Backlog Indicator, backlogs remain sufficient to support solid nonresidential spending activity through the balance of 2019. And while many economists remain concerned about economic prospects in 2020 and beyond, nonresidential construction’s outlook remains benign at least into 2021.”


Related Stories

Hotel Facilities | Jan 22, 2024
U.S. hotel construction is booming, with a record-high 5,964 projects in the pipeline
The hotel construction pipeline hit record project counts at Q4, with the addition of 260 projects and 21,287 rooms over last quarter, according to Lodging Econometrics.

Multifamily Housing | Jan 15, 2024
Multifamily rent growth rate unchanged at 0.3%
The National Multifamily Report by Yardi Matrix highlights the highs and lows of the multifamily market in 2023. Despite strong demand, rent growth remained unchanged at 0.3 percent.

Self-Storage Facilities | Jan 5, 2024
The state of self-storage in early 2024
As the housing market cools down, storage facilities suffer from lower occupancy and falling rates, according to the December 2023 Yardi Matrix National Self Storage Report.

Designers | Dec 25, 2023
Redefining the workplace is a central theme in Gensler’s latest Design Report
The firm identifies eight mega trends that mostly stress human connections.

Contractors | Dec 12, 2023
The average U.S. contractor has 8.5 months worth of construction work in the pipeline, as of November 2023
Associated Builders and Contractors reported today that its Construction Backlog Indicator inched up to 8.5 months in November from 8.4 months in October, according to an ABC member survey conducted Nov. 20 to Dec. 4. The reading is down 0.7 months from November 2022.

Market Data | Nov 27, 2023
Number of employees returning to the office varies significantly by city
While the return-to-the-office trend is felt across the country, the percentage of employees moving back to their offices varies significantly according to geography, according to Eptura’s Q3 Workplace Index.

Market Data | Nov 14, 2023
The average U.S. contractor has 8.4 months worth of construction work in the pipeline, as of September 2023
Associated Builders and Contractors reported that its Construction Backlog Indicator declined to 8.4 months in October from 9.0 months in September, according to an ABC member survey conducted from Oct. 19 to Nov. 2. The reading is down 0.4 months from October 2022. Backlog now stands at its lowest level since the first quarter of 2022.

Multifamily Housing | Nov 9, 2023
Multifamily project completions forecast to slow starting 2026
Yardi Matrix has released its Q4 2023 Multifamily Supply Forecast, emphasizing a short-term spike and plateau of new construction.

Contractors | Nov 1, 2023
Nonresidential construction spending increases for the 16th straight month, in September 2023
National nonresidential construction spending increased 0.3% in September, according to an Associated Builders and Contractors analysis of data published today by the U.S. Census Bureau. On a seasonally adjusted annualized basis, nonresidential spending totaled $1.1 trillion.

Market Data | Oct 23, 2023
New data finds that the majority of renters are cost-burdened
The most recent data derived from the 2022 Census American Community Survey reveals that the proportion of American renters facing housing cost burdens has reached its highest point since 2012, undoing the progress made in the ten years leading up to the pandemic.


