

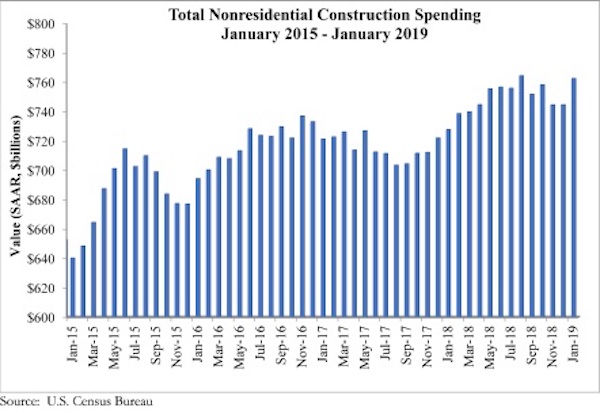
National nonresidential construction spending rose 2.4% in January, according to an Associated Builders and Contractors analysis of U.S. Census Bureau data released today. At a seasonally adjusted annualized rate, nonresidential spending totaled $762.5 billion for the month, an increase of 4.8% over the previous year. Public nonresidential construction spending expanded 4.9% in January and private spending increased 0.8%. Both public and private nonresidential spending are up 8.5% and 2.4%, respectively, on a yearly basis.
“An uptick in investment in certain infrastructure categories has been at the center of the ongoing nonresidential construction spending cycle,” said ABC Chief Economist Anirban Basu. “During the past year, construction spending has increased at rapid rates in conservation and development, highway and street, and transportation. While there has been much discussion about expanding infrastructure investment at the federal level, most of that investment has taken place at a state and local level, especially as government finances have improved in much of the nation, therefore supplying more support for infrastructure outlays. Significant job growth also has helped bolster income tax collections while rising real estate values have triggered improved property tax collections.
“Meanwhile, still reasonably strong consumer spending has helped support growing construction in segments like lodging,” said Basu. “Construction of data and fulfillment centers also has created demand for nonresidential construction services. The recent moderation in construction materials price increases has helped support construction starts because more developers and their financiers are concluding that new projects make business sense.
“While there has been some reduction in business and consumer confidence, the nonresidential construction spending cycle remains firmly in place for now,” said Basu. “Despite the recent dip in ABC’s Construction Backlog Indicator, backlogs remain sufficient to support solid nonresidential spending activity through the balance of 2019. And while many economists remain concerned about economic prospects in 2020 and beyond, nonresidential construction’s outlook remains benign at least into 2021.”


Related Stories

Market Data | Mar 14, 2024
Download BD+C's March 2024 Market Intelligence Report
U.S. construction spending on buildings-related work rose 1.4% in January, but project teams continue to face headwinds related to inflation, interest rates, and supply chain issues, according to Building Design+Construction's March 2024 Market Intelligence Report (free PDF download).

Contractors | Mar 12, 2024
The average U.S. contractor has 8.1 months worth of construction work in the pipeline, as of February 2024
Associated Builders and Contractors reported that its Construction Backlog Indicator declined to 8.1 months in February, according to an ABC member survey conducted Feb. 20 to March 5. The reading is down 1.1 months from February 2023.

Market Data | Mar 6, 2024
Nonresidential construction spending slips 0.4% in January
National nonresidential construction spending decreased 0.4% in January, according to an Associated Builders and Contractors analysis of data published today by the U.S. Census Bureau. On a seasonally adjusted annualized basis, nonresidential spending totaled $1.190 trillion.

Multifamily Housing | Mar 4, 2024
Single-family rentals continue to grow in BTR communities
Single-family rentals are continuing to grow in built-to-rent communities. Both rent and occupancy growth have been strong in recent months while remaining a financially viable option for renters.

MFPRO+ News | Mar 2, 2024
Job gains boost Yardi Matrix National Rent Forecast for 2024
Multifamily asking rents broke the five-month streak of sequential average declines in January, rising 0.07 percent, shows a new special report from Yardi Matrix.

K-12 Schools | Feb 29, 2024
Average age of U.S. school buildings is just under 50 years
The average age of a main instructional school building in the United States is 49 years, according to a survey by the National Center for Education Statistics (NCES). About 38% of schools were built before 1970. Roughly half of the schools surveyed have undergone a major building renovation or addition.

MFPRO+ Research | Feb 27, 2024
Most competitive rental markets of early 2024
The U.S. rental market in early 2024 is moderately competitive, with apartments taking an average of 41 days to find tenants, according to the latest RentCafe Market Competitivity Report.

Construction Costs | Feb 22, 2024
K-12 school construction costs for 2024
Data from Gordian breaks down the average cost per square foot for four different types of K-12 school buildings (elementary schools, junior high schools, high schools, and vocational schools) across 10 U.S. cities.

Student Housing | Feb 21, 2024
Student housing preleasing continues to grow at record pace
Student housing preleasing continues to be robust even as rent growth has decelerated, according to the latest Yardi Matrix National Student Housing Report.

Architects | Feb 21, 2024
Architecture Billings Index remains in 'declining billings' state in January 2024
Architecture firm billings remained soft entering into 2024, with an AIA/Deltek Architecture Billings Index (ABI) score of 46.2 in January. Any score below 50.0 indicates decreasing business conditions.


