U.S. construction outlook softens as tariffs and labor pressures keep costs elevated

Construction spending across the US slowed in the second half of 2025, but costs remain elevated and uneven across regions, according to Turner & Townsend’s H2 2025 US market intelligence report.
A new report published by the global professional services company Turner & Townsend on H2 2025 US construction provides market and regional analysis, as well as economic insights from our team of experts.
While economic growth cooled and private construction pulled back, federally backed infrastructure, data centers, and trade‑driven supply chain shifts are keeping bid price escalation above historical norms—particularly in Phoenix, Dallas‑Fort Worth, and San Francisco, which rank highest nationally for cost escalation pressure.
Key findings:
- 1.4% Quarterly GDP growth as of Q4 2025 (annual rate)
- -0.36% Quarter on year construction spending growth as of December 2025
- 4.25% Bid price inflation (escalation) estimate for 2026
Macro conditions are softening. GDP growth slowed sharply in Q4; the February benchmark revision revealed far fewer jobs than initially reported, and the Fed has paused after 75 basis points of cuts with limited further easing expected.
- Construction spending remained weak throughout the second half of 2025, running 1.0% below year-ago levels by December 2026.
- Private construction has been most impacted, declining nearly 3.0% year-over-year, while public construction posted full-year gains of 3.6%.
- Manufacturing construction accelerated its retreat, falling more than 11% year-on-year.
Sector highlights
- Total construction spending declined about -0.36% in nominal terms year-over-year in Q4 2025, and after adjusting for cost increases, real output contracted further.
- Private construction drove the spending decline throughout the second half of 2025, with declining from US$1.70 trillion seasonally adjusted annual rate in Q3 2024 to US$1.65 trillion in Q4 2025, a 3.0% year-over-year drop in Q3 and 1.5% drop in Q4.
- While public construction provided some counterweight, expanding 4.0% year-on-year in Q3 2025 and 3.5% in Q4, reaching US$521.7 billion SAAR in December.
- Manufacturing remains the largest non-residential subcategory, but its retreat accelerated through 2025. Spending fell to $202.4bn SAAR in Q4 2025, down 11.4% year-over-year, the steepest annual decline of any major category.
- Healthcare edged down 1.4% to $68.7bn.
- Office increased 2.4% to $107.6bn, a modest but notable stabilization given persistent remote work headwinds.
- Amusement and recreation rose 6.1% to $44.4bn, reflecting sustained investment in sports venues and entertainment districts.
- Transportation construction rose 5.3% year-over-year to $68.9bn, while power construction grew 5.8% to US$162.4bn, sustained by data center growth and grid modernization programs.
Cost outlook
Looking ahead, public investment should help cushion the sector as infrastructure spending flows from federal programs. Private construction faces headwinds from elevated financing costs and manufacturing project slowdowns. Labor constraints persist despite softening demand, and the tariff landscape remains fluid.
Turner & Townsend expects bid price escalation to remain elevated but gradually ease:
- 2026: 4.25% as tariffs and labor pressures persist
- 2027: 4.0% as lending conditions stabilize and demand softens
- 2028: 3.75% as infrastructure spending peaks and private construction remains subdued
Regional insight
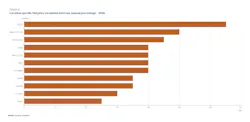
The report analyzes 10 major US markets, assessing economic conditions, labor availability, and supply chain capacity. Phoenix, Dallas–Fort Worth, and San Francisco show the strongest upward pressure on construction costs over the next 12 months. Review regional insights.
National bid price escalation forecast, annual percentage change chart: