At the end of 2018, analysts at Lodging Econometrics (LE) reported that the total U.S. construction pipeline continued to trend upward with 5,530 projects/669,456 rooms, both up a strong 7% year-over-year (YOY). However, pipeline totals continue to trail the all-time high of 5,883 projects/785,547 rooms reached in the second quarter of 2008.
Project counts in the early planning stage continue to rise reaching an all-time high of 1,723 projects/199,326 rooms, up 14% by projects and 12% by rooms YOY. Projects scheduled to start construction in the next 12 months stand at 2,153 projects/255,083 rooms. Projects currently under construction are at 1,654 projects/215,047 rooms, the highest counts since early 2008.
Also noteworthy at year-end, the upscale, upper-midscale, and midscale categories are at record-highs, for both rooms and projects. Luxury room counts and upper-upscale project counts are also at record levels.
In 2018, the U.S. had 947 new hotels/112,050 rooms open, a 2% growth in new supply, bringing the total U.S. census to 56,909 hotels/5,381,090 rooms. The LE forecast for new hotel openings in 2019 anticipates a 2.2% supply growth rate with 1,022 new hotels/116,357 rooms expected to open. The pace for new hotel openings has slowed slightly because of construction delays largely caused by shortages in skilled labor.
Lending at attractive rates is still accessible to developers, but lenders are growing more selective as we move deeper into the existing cycle.
The pipeline has completed its seventh consecutive year of growth. Moving forward the growth rate is expected to slow as the economies of most countries, including the United States, more firmly settle into the “new normal" marked by slow growth and low inflation.
While there are no visible signs of a recession on the horizon, the risks to the economy are not insignificant and include tariff conflicts, swings in the stock market, unforeseen geopolitical problems, any of which could send the economy lower.
Related Stories
Market Data | Apr 6, 2017
Architecture marketing: 5 tools to measure success
We’ve identified five architecture marketing tools that will help your firm evaluate if it’s on the track to more leads, higher growth, and broader brand visibility.
Market Data | Apr 3, 2017
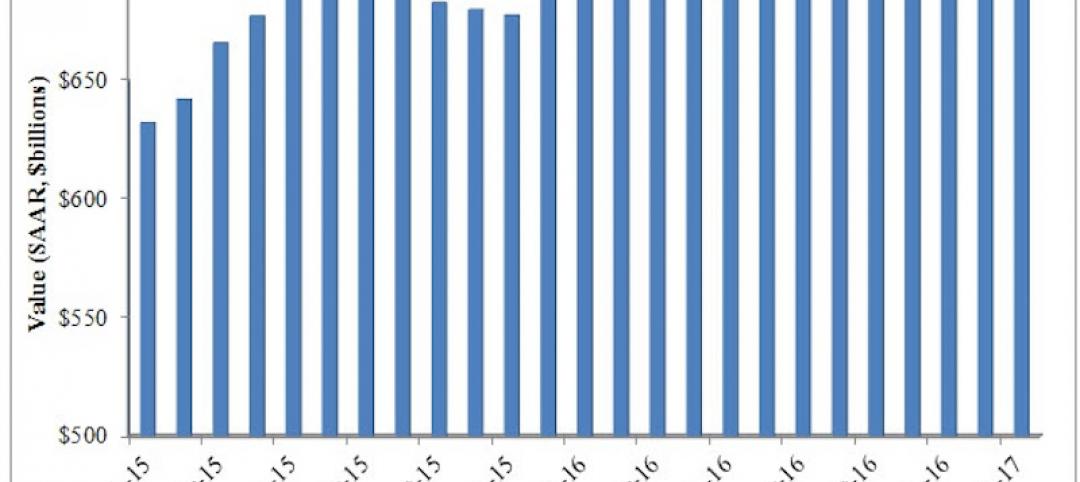
Public nonresidential construction spending rebounds; overall spending unchanged in February
The segment totaled $701.9 billion on a seasonally adjusted annualized rate for the month, marking the seventh consecutive month in which nonresidential spending sat above the $700 billion threshold.
Market Data | Mar 29, 2017
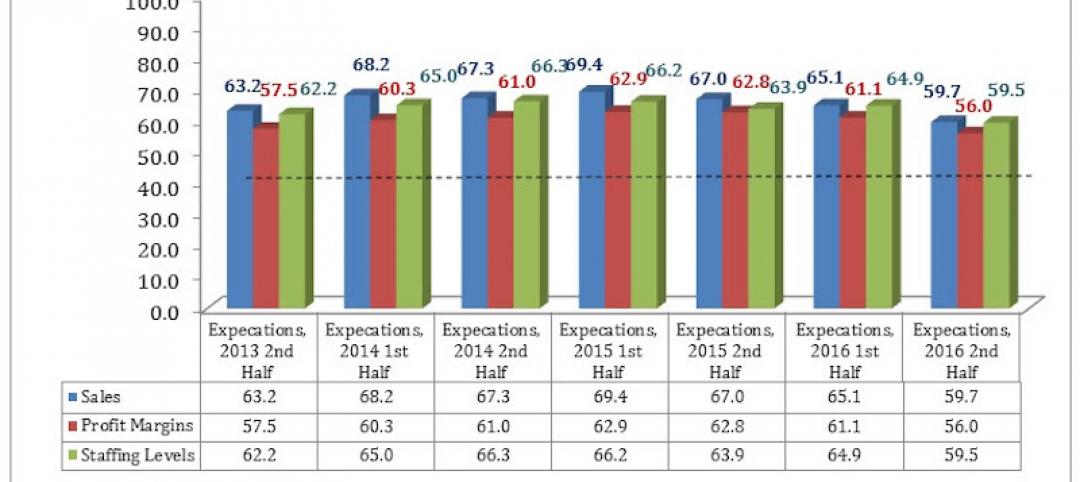
Contractor confidence ends 2016 down but still in positive territory
Although all three diffusion indices in the survey fell by more than five points they remain well above the threshold of 50, which signals that construction activity will continue to be one of the few significant drivers of economic growth.
Market Data | Mar 24, 2017
These are the most and least innovative states for 2017
Connecticut, Virginia, and Maryland are all in the top 10 most innovative states, but none of them were able to claim the number one spot.
Market Data | Mar 22, 2017
After a strong year, construction industry anxious about Washington’s proposed policy shifts
Impacts on labor and materials costs at issue, according to latest JLL report.
Market Data | Mar 22, 2017
Architecture Billings Index rebounds into positive territory
Business conditions projected to solidify moving into the spring and summer.
Market Data | Mar 15, 2017
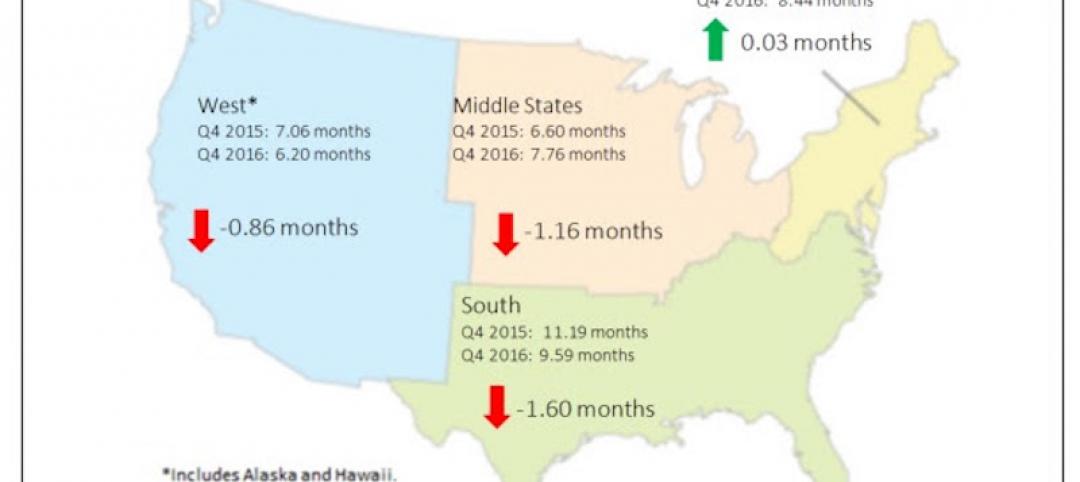
ABC's Construction Backlog Indicator fell to end 2016
Contractors in each segment surveyed all saw lower backlog during the fourth quarter, with firms in the heavy industrial segment experiencing the largest drop.
Market Data | Feb 28, 2017
Leopardo’s 2017 Construction Economics Report shows year-over-year construction spending increase of 4.2%
The pace of growth was slower than in 2015, however.
Market Data | Feb 23, 2017
Entering 2017, architecture billings slip modestly
Despite minor slowdown in overall billings, commercial/ industrial and institutional sectors post strongest gains in over 12 months.
Market Data | Feb 16, 2017
How does your hospital stack up? Grumman/Butkus Associates 2016 Hospital Benchmarking Survey
Report examines electricity, fossil fuel, water/sewer, and carbon footprint.


