

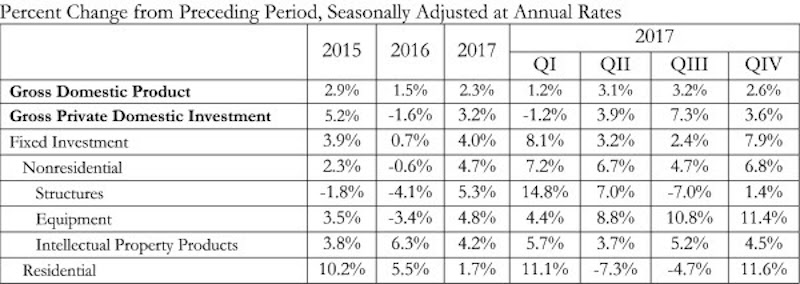
The U.S. economy grew by 2.3% in 2017, while fixed investment increased at a annual rate of 7.9%, according to an Associated Builders and Contractors (ABC) analysis of data released today by the Bureau of Economic Analysis.
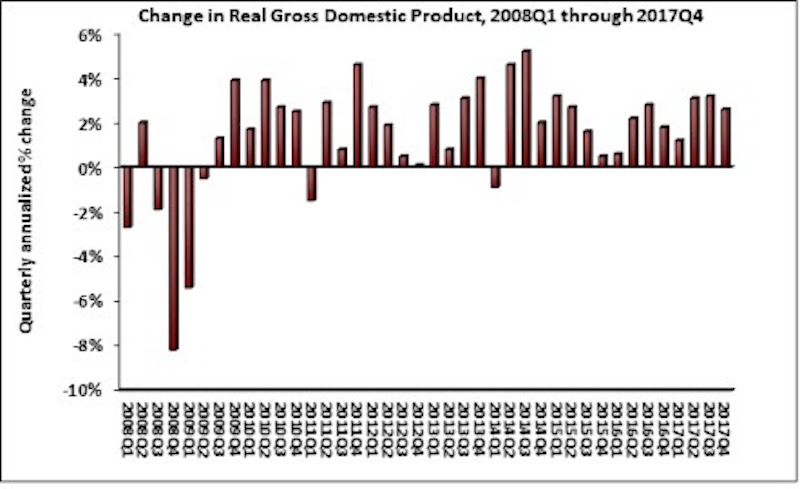
The economy expanded at an annual rate of 2.6% during the fourth quarter of 2017 after expanding at a 3.2% rate during the third quarter. Nonresidential fixed investment performed similarly to overall fixed investment in the fourth quarter by increasing at a 6.8% rate. This represents the third time in the past four quarters that nonresidential fixed investment increased by at least 6.7%.
The year-end figure for GDP growth of 2.3% is up from 1.5% in 2016 but down from the 2.9% figure posted in 2015. Nonresidential fixed investment increased 4.7% in 2017, its best year since increasing 6.9% in 2014. This followed a 0.6% contraction in 2016.
“Many will look at this report and conclude that consumer spending, the largest component of the economy, drove fourth quarter growth by expanding at a 3.8% annual rate,” said ABC Chief Economist Anirban Basu. “Upon further inspection, however, the fourth quarter consumer spending missed its 3% expectation due to imports increasing at twice the rate of exports. This widening trade deficit subtracted 1.13 percentage points from fourth quarter GDP growth.
“The factors that have helped to accelerate economic growth in America remain in place, including a strengthening global economy, abundant consumer and business confidence, elevated liquidity flowing through the veins of the international financial system and deregulation,” said Basu. “Stakeholders should be aware that although many companies have announced big plans for stepped-up investment, staffing and compensation—due at least in part to the recently enacted tax cut—the plans have yet to fully manifest within the data. The implication is that the U.S. economy is set to roar in 2018.
“As always, contractors are warned to remain wary,” said Basu. “The combination of extraordinary confidence and capital can fuel excess financial leverage and spur asset price bubbles. The implication is that as contractors remain busy, there should be an ongoing stockpiling of defensive cash. That recommendation will be difficult for many contractors to implement, however, with labor shortages and materials costs rising more rapidly and slender profit margins in many construction segments.”

Related Stories

Market Data | Jun 21, 2017
Design billings maintain solid footing, strong momentum reflected in project inquiries/design contracts
Balanced growth results in billings gains in all sectors.

Market Data | Jun 16, 2017
Residential construction was strong, but not enough, in 2016
The Joint Center for Housing Studies’ latest report expects minorities and millennials to account for the lion’s share of household formations through 2035.

Industry Research | Jun 15, 2017
Commercial Construction Index indicates high revenue and employment expectations for 2017
USG Corporation (USG) and U.S. Chamber of Commerce release survey results gauging confidence among industry leaders.

Market Data | Jun 2, 2017
Nonresidential construction spending falls in 13 of 16 segments in April
Nonresidential construction spending fell 1.7% in April 2017, totaling $696.3 billion on a seasonally adjusted, annualized basis, according to analysis of U.S. Census Bureau data released today by Associated Builders and Contractors.

Industry Research | May 25, 2017
Project labor agreement mandates inflate cost of construction 13%
Ohio schools built under government-mandated project labor agreements (PLAs) cost 13.12 percent more than schools that were bid and constructed through fair and open competition.

Market Data | May 24, 2017
Design billings increasing entering height of construction season
All regions report positive business conditions.

Market Data | May 24, 2017
The top franchise companies in the construction pipeline
3 franchise companies comprise 65% of all rooms in the Total Pipeline.

Industry Research | May 24, 2017
These buildings paid the highest property taxes in 2016
Office buildings dominate the list, but a residential community climbed as high as number two on the list.

Market Data | May 16, 2017
Construction firms add 5,000 jobs in April
Unemployment down to 4.4%; Specialty trade jobs dip slightly.

Multifamily Housing | May 10, 2017
May 2017 National Apartment Report
Median one-bedroom rent rose to $1,012 in April, the highest it has been since January.


