ConstructConnect announced today the release of its Q3 2017 Forecast Quarterly Report. The U.S. grand total construction starts growth projection for 2017 over 2016 in ConstructConnect’s Q3 report has been revised down slightly to +4.5% from +4.8%. 2018 remains about the same at +5.9% year over year (y/y). Earlier, it had been estimated at +6.0%.
“The outlook for U.S. construction starts, as calculated by ConstructConnect, has diminished slightly in the short term,” said to Chief Economist Alex Carrick. “Prospects for some private sector project initiations (e.g., in retail) have stalled, while high hopes for an early launch of a much-needed super-infrastructure program, to be sponsored, promoted and perhaps largely financed by the new administration in Washington, have been deflated.”
The forecast which combines ConstructConnect's proprietary data with macroeconomic factors and Oxford Economics econometric expertise, shows the type-of-structure sub-categories among non-residential building starts that will have banner years in 2017:
- Hotels/motels (+38.2%)
- Warehouses (+16.3%)
- Sports stadiums (+47.3%)
- Courthouses (+110.0%)
The 2017 forecast for non-residential building starts was adjusted to -0.8% y/y, versus a flat (0.0%) performance that was expected in Q2’s forecast report. According to the forecast, non-residential building starts in 2018 will rebound to +3.3%, with private office buildings and industrial/manufacturing doing better with less downward drag being exerted by retail and medical projects. The boom in hotel/motel work will begin to lose steam.
Based on a heightened record of ‘actual’ starts through the first half of this year (+25.2%), civil/engineering starts in 2017 were revised upwards to +16.5% y/y from +8.9% in Q2’s report. 2018 growth in this category has also been raised, to +7.4% (from +5.8%).
The forecast includes a few notable high points in the 2017 y/y engineering sub-categories:
- Airports (+38.0%)
- Roads (+14.0%)
- Bridges (+31.0%)
- Power/oil and gas (+30.8%)
The report states among major sub-sectors, residential construction’s 2017 y/y increase has been scaled down to +4.8% from +8.1%. The robust multi-family market of the last several years has been pulling back of late, as rental rates in many regions soared. Single-family starts also stalled, despite a need for substantial growth activity, since they declined so horrendously in the Great Recession. Also, new family formations, specifically among millennials, point to a tremendous potential that for the moment is not being realized.
Related Stories
Market Data | Apr 20, 2021
Demand for design services continues to rapidly escalate
AIA’s ABI score for March rose to 55.6 compared to 53.3 in February.
Market Data | Apr 16, 2021
Construction employment in March trails March 2020 mark in 35 states
Nonresidential projects lag despite hot homebuilding market.
Market Data | Apr 13, 2021
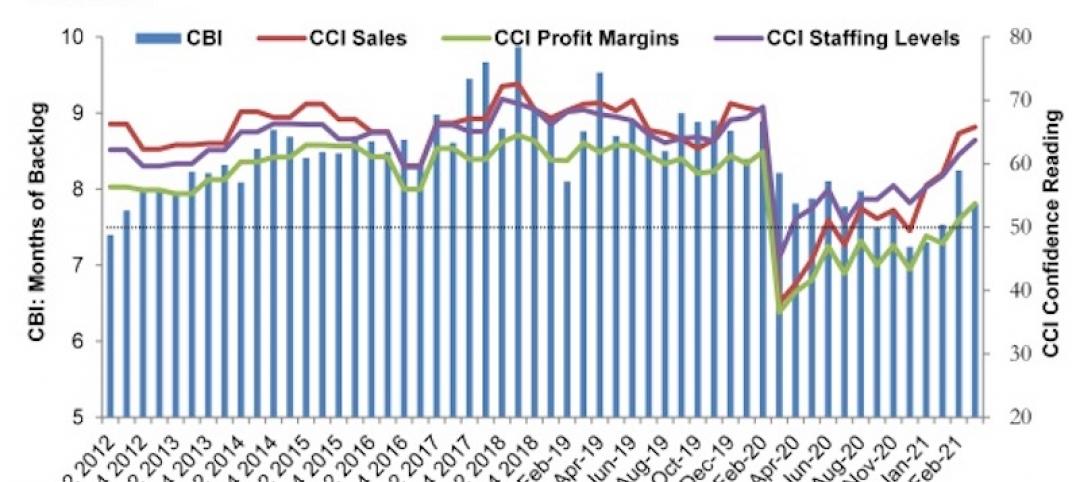
ABC’s Construction Backlog slips in March; Contractor optimism continues to improve
The Construction Backlog Indicator fell to 7.8 months in March.
Market Data | Apr 9, 2021
Record jump in materials prices and supply chain distributions threaten construction firms' ability to complete vital nonresidential projects
A government index that measures the selling price for goods used construction jumped 3.5% from February to March.
Contractors | Apr 9, 2021
Construction bidding activity ticks up in February
The Blue Book Network's Velocity Index measures month-to-month changes in bidding activity among construction firms across five building sectors and in all 50 states.
Industry Research | Apr 9, 2021
BD+C exclusive research: What building owners want from AEC firms
BD+C’s first-ever owners’ survey finds them focused on improving buildings’ performance for higher investment returns.
Market Data | Apr 7, 2021
Construction employment drops in 236 metro areas between February 2020 and February 2021
Houston-The Woodlands-Sugar Land and Odessa, Texas have worst 12-month employment losses.
Market Data | Apr 2, 2021
Nonresidential construction spending down 1.3% in February, says ABC
On a monthly basis, spending was down in 13 of 16 nonresidential subcategories.
Market Data | Apr 1, 2021
Construction spending slips in February
Shrinking demand, soaring costs, and supply delays threaten project completion dates and finances.
Market Data | Mar 26, 2021
Construction employment in February trails pre-pandemic level in 44 states
Soaring costs, supply-chain problems jeopardize future jobs.


