The Trump Administration’s plans for infrastructure investment, regulatory reform, and tax relief have ignited a burst of enthusiasm among U.S. engineering firm leaders, propelling the American Council of Engineering Companies’ Engineering Business Index (EBI) to its largest ever quarterly increase.
The 4th Quarter 2016 (Q4/2016) EBI surged 5.1 points to 66.5, up from the 61.4 score of Q3/2016. The previous largest increase was 1.5 points between the Q1/2014 and Q2/2014 surveys. Any score above 50 signifies that the market is growing The EBI is a leading indicator of America’s economic health based on the business performance and projections of engineering firms responsible for developing the nation’s transportation, water, energy, and industrial infrastructure. The Q4/2016 survey of 317 engineering firm leaders was conducted November 31 to December 20.
Survey results show firm leader market expectations for one year from today rose a hefty 8.8 points to 72.1, the largest quarter-over-quarter increase since the EBI’s inception in January 2014. Expectations for both short- and long-term profitability also climbed. Firm leader optimism for improved profitability over the next six months rose 3.6 points to 69.0; increased to 72.9 for one year from now; and climbed 2.9 points to 70.5 for three years from now.
“We finally have a president who understands business!” says one respondent. “We’re looking forward to some significant tax relief with the new Administration,” says another.
The boost in firm leader optimism extends across almost the entire engineering marketplace. In public markets, transportation showed the strongest increase, up an eye-catching 9.5 points to 73.7.
All other public market sectors rose: Water and Wastewater (up 7.5, to 70.5), Education (up 3.2 to 58.2) Health Care (up 0.3, to 56.1), and Environmental (up 1.1 to 55.4). A new public sector category, Buildings, debuted at 65.2. Among the private client markets, firm leaders were most bullish about the Industrial/Manufacturing sector, which leaped up 12.5 points to 70.7. Four key private sector markets also climbed: Energy and Power (up 8.8, to 69.2), Land Development (up 8.2, to 68.4.), Buildings (up 4.1 to 67.0), and Education (up 5.2, to 58.5).
For the complete Quarter 4, 2016 Engineering Business Index, go to www.acec.org.
Related Stories
Market Data | Apr 11, 2023
Construction crane count reaches all-time high in Q1 2023
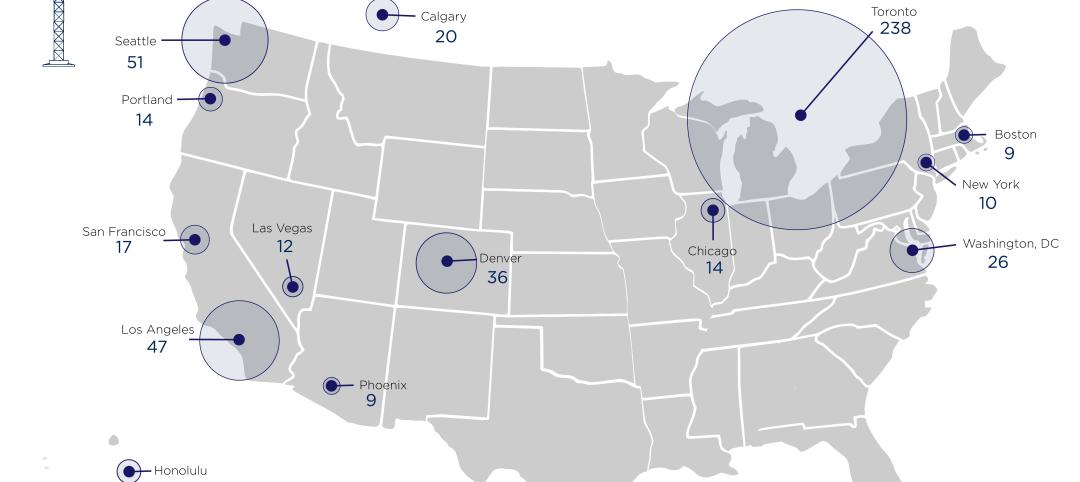
Toronto, Seattle, Los Angeles, and Denver top the list of U.S/Canadian cities with the greatest number of fixed cranes on construction sites, according to Rider Levett Bucknall's RLB Crane Index for North America for Q1 2023.
Contractors | Apr 11, 2023
The average U.S. contractor has 8.7 months worth of construction work in the pipeline, as of March 2023
Associated Builders and Contractors reported that its Construction Backlog Indicator declined to 8.7 months in March, according to an ABC member survey conducted March 20 to April 3. The reading is 0.4 months higher than in March 2022.
Market Data | Apr 6, 2023
JLL’s 2023 Construction Outlook foresees growth tempered by cost increases
The easing of supply chain snags for some product categories, and the dispensing with global COVID measures, have returned the North American construction sector to a sense of normal. However, that return is proving to be complicated, with the construction industry remaining exceptionally busy at a time when labor and materials cost inflation continues to put pricing pressure on projects, leading to caution in anticipation of a possible downturn. That’s the prognosis of JLL’s just-released 2023 U.S. and Canada Construction Outlook.
Market Data | Apr 4, 2023
Nonresidential construction spending up 0.4% in February 2023
National nonresidential construction spending increased 0.4% in February, according to an Associated Builders and Contractors analysis of data published by the U.S. Census Bureau. On a seasonally adjusted annualized basis, nonresidential spending totaled $982.2 billion for the month, up 16.8% from the previous year.
Multifamily Housing | Mar 24, 2023
Average size of new apartments dropped sharply in 2022
The average size of new apartments in 2022 dropped sharply in 2022, as tracked by RentCafe. Across the U.S., the average new apartment size was 887 sf, down 30 sf from 2021, which was the largest year-over-year decrease.
Multifamily Housing | Mar 14, 2023
Multifamily housing rent rates remain flat in February 2023
Multifamily housing asking rents remained the same for a second straight month in February 2023, at a national average rate of $1,702, according to the new National Multifamily Report from Yardi Matrix. As the economy continues to adjust in the post-pandemic period, year-over-year growth continued its ongoing decline.
Contractors | Mar 14, 2023
The average U.S. contractor has 9.2 months worth of construction work in the pipeline, as of February 2023
Associated Builders and Contractors reported today that its Construction Backlog Indicator increased to 9.2 months in February, according to an ABC member survey conducted Feb. 20 to March 6. The reading is 1.2 months higher than in February 2022.
Industry Research | Mar 9, 2023
Construction labor gap worsens amid more funding for new infrastructure, commercial projects
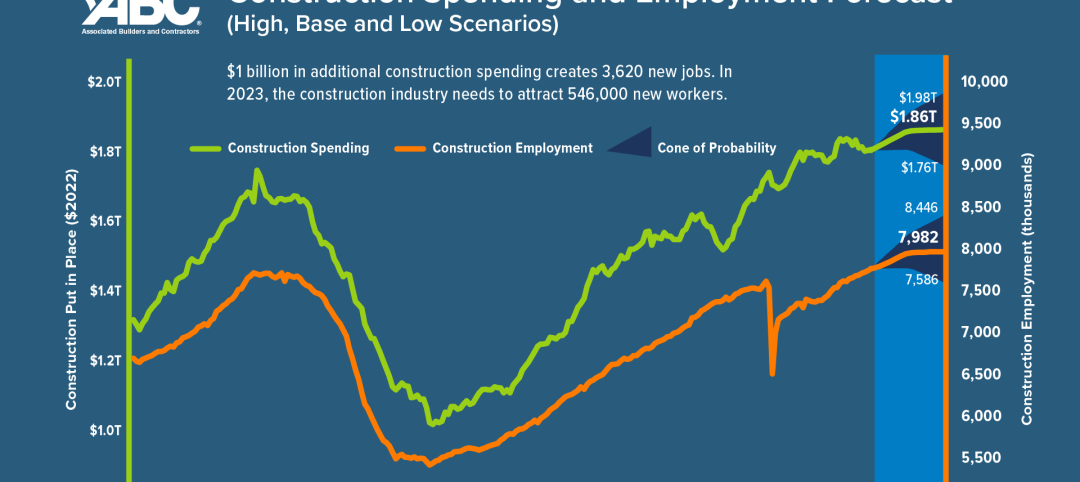
The U.S. construction industry needs to attract an estimated 546,000 additional workers on top of the normal pace of hiring in 2023 to meet demand for labor, according to a model developed by Associated Builders and Contractors. The construction industry averaged more than 390,000 job openings per month in 2022.
Market Data | Mar 7, 2023
AEC employees are staying with firms that invest in their brand
Hinge Marketing’s latest survey explores workers’ reasons for leaving, and offers strategies to keep them in the fold.
Multifamily Housing | Feb 21, 2023
Multifamily housing investors favoring properties in the Sun Belt
Multifamily housing investors are gravitating toward Sun Belt markets with strong job and population growth, according to new research from Yardi Matrix. Despite a sharp second-half slowdown, last year’s nationwide $187 billion transaction volume was the second-highest annual total ever.


