

Ben Franklin is often attributed as saying only two things are certain in life: death and taxes. While this quote rings true, it can be assumed Franklin didn’t predict some entities would be handed a tax bill of $71 million for property taxes alone, but that is exactly what Manhattan’s GM Building faced in 2016.
According to research conducted by COMMERCIALCafé, the GM Building had the highest property taxes in the country in 2016. Of the top 10 properties with the highest taxes, nine were associated with office buildings, but it is a residential community that takes the second spot on the list. Stuyvesant Town came in behind the General Motors Building, paying $60.5 million for property taxes in 2016.
The Metlife Building, 1345 Avenue of the Americas, and 1221 Avenue of the Americas, all in New York City, round out the top five.
Each property in the top ten resides in New York. In fact, you need to go down the list all the way to number 13 before arriving at a property not in New York, but Illinois. The Illinois entry to the list isn’t what you would expect, either. Not only was the first Illinois building on the list not the Willis Tower, but it wasn’t even a building in Chicago.
The first building on the list not in New York is the Exelon – Byron Nuclear Generating Station in Byron, Ill. The nuclear station paid $36.5 million in property taxes in 2016. Chicago’s Willis Tower doesn’t make an appearance until number 28 on the list, with $28.4 million paid in property taxes.
Minnesota’s Mall of America makes the list as the highest retail property at number 25 with $30 million in 2016 property taxes. Woodfield Mall, in Schaumburg, Ill., is the next closest retail property on the list at number 40 with $24 million paid in 2016.
The New York Marriott Marquis Hotel is the highest hotel on the list, at number 11, with a total of $36.6 million paid in 2016. The next closest was the New York Hilton Midtown Manhattan Hotel at number 39, with a total of $24.3 million.
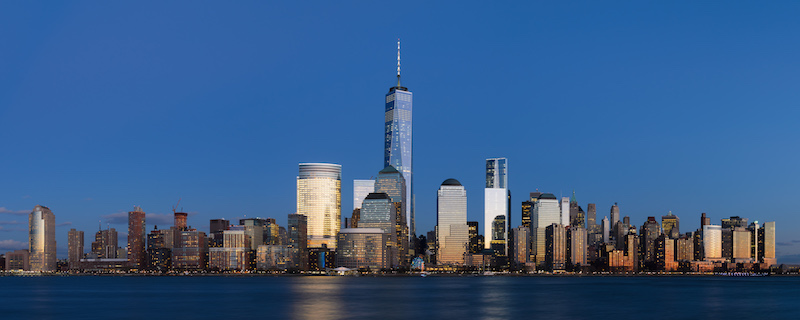
Some buildings you may expect to see on the list, such as New York’s Chrysler Building or One World Trade Center, are nowhere to be found. This is because these structures, and other landmark buildings (Woolworth Building) are tax exempt. The Port Authority of New York & New Jersey, for example, owns One World Trade Center, so it doesn’t pay property taxes.
To view the entire Top 100 list, click here.
Related Stories

Engineers | May 3, 2017
At first buoyed by Trump election, U.S. engineers now less optimistic about markets, new survey shows
The first quarter 2017 (Q1/17) of ACEC’s Engineering Business Index (EBI) dipped slightly (0.5 points) to 66.0.

Market Data | May 2, 2017
Nonresidential Spending loses steam after strong start to year
Spending in the segment totaled $708.6 billion on a seasonally adjusted, annualized basis.

Market Data | May 1, 2017
Nonresidential Fixed Investment surges despite sluggish economic in first quarter
Real gross domestic product (GDP) expanded 0.7 percent on a seasonally adjusted annualized rate during the first three months of the year.

Industry Research | Apr 28, 2017
A/E Industry lacks planning, but still spending large on hiring
The average 200-person A/E Firm is spending $200,000 on hiring, and not budgeting at all.
Architects | Apr 27, 2017
Number of U.S. architects holds steady, while professional mobility increases
New data from NCARB reveals that while the number of architects remains consistent, practitioners are looking to get licensed in multiple states.

Market Data | Apr 6, 2017
Architecture marketing: 5 tools to measure success
We’ve identified five architecture marketing tools that will help your firm evaluate if it’s on the track to more leads, higher growth, and broader brand visibility.

Market Data | Apr 3, 2017
Public nonresidential construction spending rebounds; overall spending unchanged in February
The segment totaled $701.9 billion on a seasonally adjusted annualized rate for the month, marking the seventh consecutive month in which nonresidential spending sat above the $700 billion threshold.

Market Data | Mar 29, 2017
Contractor confidence ends 2016 down but still in positive territory
Although all three diffusion indices in the survey fell by more than five points they remain well above the threshold of 50, which signals that construction activity will continue to be one of the few significant drivers of economic growth.

Industry Research | Mar 24, 2017
The business costs and benefits of restroom maintenance
Businesses that have pleasant, well-maintained restrooms can turn into customer magnets.

Industry Research | Mar 22, 2017
Progress on addressing US infrastructure gap likely to be slow despite calls to action
Due to a lack of bipartisan agreement over funding mechanisms, as well as regulatory hurdles and practical constraints, Moody’s expects additional spending to be modest in 2017 and 2018.


