

In its latest report on the U.S. office market, JLL notes that a second-quarter rebound this year delivered 11.7 million sf of new office space. Much of what’s being built in the office sector is occurring in the central business districts of cities around the country, as companies gravitate closer to where they believe they’ll have their best shots at attracting Millennial workers.
But to paraphrase Mark Twain, news of the death of suburban office space may be greatly exaggerated. Corporate America hasn’t quite abandoned the suburbs to the extent that some experts were predicting not to long ago.
In its Second-Quarter 2017 Office Market Report, Transwestern singles out New Jersey, where “renewed interest” in suburban office properties helped push the Garden State’s overall average office rents to $26.42 per sf, nearly $2 per sf higher than five years ago and the market’s highest mid-year level since 2001.
CBRE this summer looked at the 25 largest suburban markets it covers, and found “they have performed better than is commonly perceived.” CBRE went on to state that suburban office submarkets with urban characteristics—higher densities of office space, housing, and retail, as well as transportation access—are in the best position to capture occupier demand.
CBRE also found that rents in more than half of the most established suburban submarkets exceed their downtown counterparts.
Despite the flight from suburbs to cities over the past few years by such high-profile companies as General Electric, McDonald’s, Aetna, and ConAgra, suburban and urban office properties that collateralize commercial mortgage-backed securities (CMBS) loans have comparable occupancy rates (89.1% vs. 89.6%), according to a new analysis by Trepp, a leading data provider to the CMBS and banking industries.
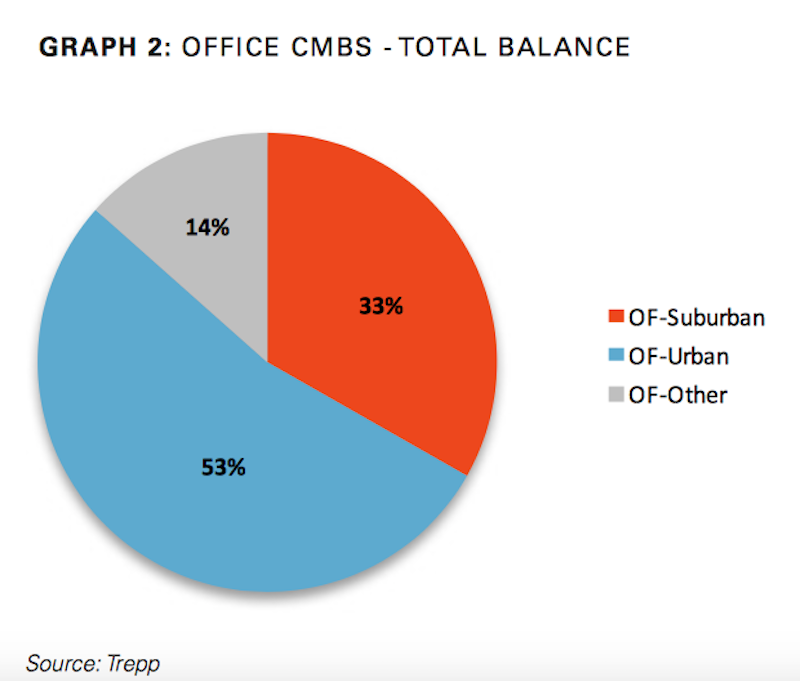
Suburban office loans account for one-third of outstanding CMBS debt. However, they are often more distressed than urban office loans, and have higher rates of delinquency. Image: Trepp
Trepp estimates that suburban office loans account for one-third of the $125.1 billion in outstanding CMBS debt. And new issuance for suburban offices reached $3.2 billion in the first half of 2017, up 43% compared to the same period a year ago. Trepp infers that from these data that “demand is still relatively steady” for suburban office space.
There are caveats, though, not the least of which being that suburban offices carry the highest percentage of distressed debt in the sector: 14.5%, compared to 4.9% for urban office loans. Suburban office loans also carry a noticeably high delinquency rate: 13.3%, which is down from 15.9% in April, but still nearly five percentage points higher than the broader office sector’s delinquencies.
In its analysis, Trepp quotes from Hartford Business, a journal in Connecticut, which observes that the nationwide migration toward urban office space is often a management trend, where companies are reallocating resources and their top talent to office space in cities, but still keep the bulk of their employees in suburban offices.
Related Stories

Architects | Apr 21, 2023
Architecture billings improve slightly in March
Architecture firms reported a modest increase in March billings. This positive news was tempered by a slight decrease in new design contracts according to a new report released today from The American Institute of Architects (AIA). March was the first time since last September in which billings improved.

Contractors | Apr 19, 2023
Rising labor, material prices cost subcontractors $97 billion in unplanned expenses
Subcontractors continue to bear the brunt of rising input costs for materials and labor, according to a survey of nearly 900 commercial construction professionals.

Data Centers | Apr 14, 2023
JLL's data center outlook: Cloud computing, AI driving exponential growth for data center industry
According to JLL’s new Global Data Center Outlook, the mass adoption of cloud computing and artificial intelligence (AI) is driving exponential growth for the data center industry, with hyperscale and edge computing leading investor demand.

Healthcare Facilities | Apr 13, 2023
Healthcare construction costs for 2023
Data from Gordian breaks down the average cost per square foot for a three-story hospital across 10 U.S. cities.

Higher Education | Apr 13, 2023
Higher education construction costs for 2023
Fresh data from Gordian breaks down the average cost per square foot for a two-story college classroom building across 10 U.S. cities.

Market Data | Apr 13, 2023
Construction input prices down year-over-year for first time since August 2020
Construction input prices increased 0.2% in March, according to an Associated Builders and Contractors analysis of U.S. Bureau of Labor Statistics Producer Price Index data released today. Nonresidential construction input prices rose 0.4% for the month.

Market Data | Apr 11, 2023
Construction crane count reaches all-time high in Q1 2023
Toronto, Seattle, Los Angeles, and Denver top the list of U.S/Canadian cities with the greatest number of fixed cranes on construction sites, according to Rider Levett Bucknall's RLB Crane Index for North America for Q1 2023.

Contractors | Apr 11, 2023
The average U.S. contractor has 8.7 months worth of construction work in the pipeline, as of March 2023
Associated Builders and Contractors reported that its Construction Backlog Indicator declined to 8.7 months in March, according to an ABC member survey conducted March 20 to April 3. The reading is 0.4 months higher than in March 2022.

Market Data | Apr 6, 2023
JLL’s 2023 Construction Outlook foresees growth tempered by cost increases
The easing of supply chain snags for some product categories, and the dispensing with global COVID measures, have returned the North American construction sector to a sense of normal. However, that return is proving to be complicated, with the construction industry remaining exceptionally busy at a time when labor and materials cost inflation continues to put pricing pressure on projects, leading to caution in anticipation of a possible downturn. That’s the prognosis of JLL’s just-released 2023 U.S. and Canada Construction Outlook.

Market Data | Apr 4, 2023
Nonresidential construction spending up 0.4% in February 2023
National nonresidential construction spending increased 0.4% in February, according to an Associated Builders and Contractors analysis of data published by the U.S. Census Bureau. On a seasonally adjusted annualized basis, nonresidential spending totaled $982.2 billion for the month, up 16.8% from the previous year.


