


Grumman/Butkus Associates, a firm of energy efficiency consultants and sustainable design engineers, has released the results of its 2015 Hospital Energy and Water Benchmarking Survey, focusing on healthcare facilities’ resource usage trends and costs for calendar year 2014.
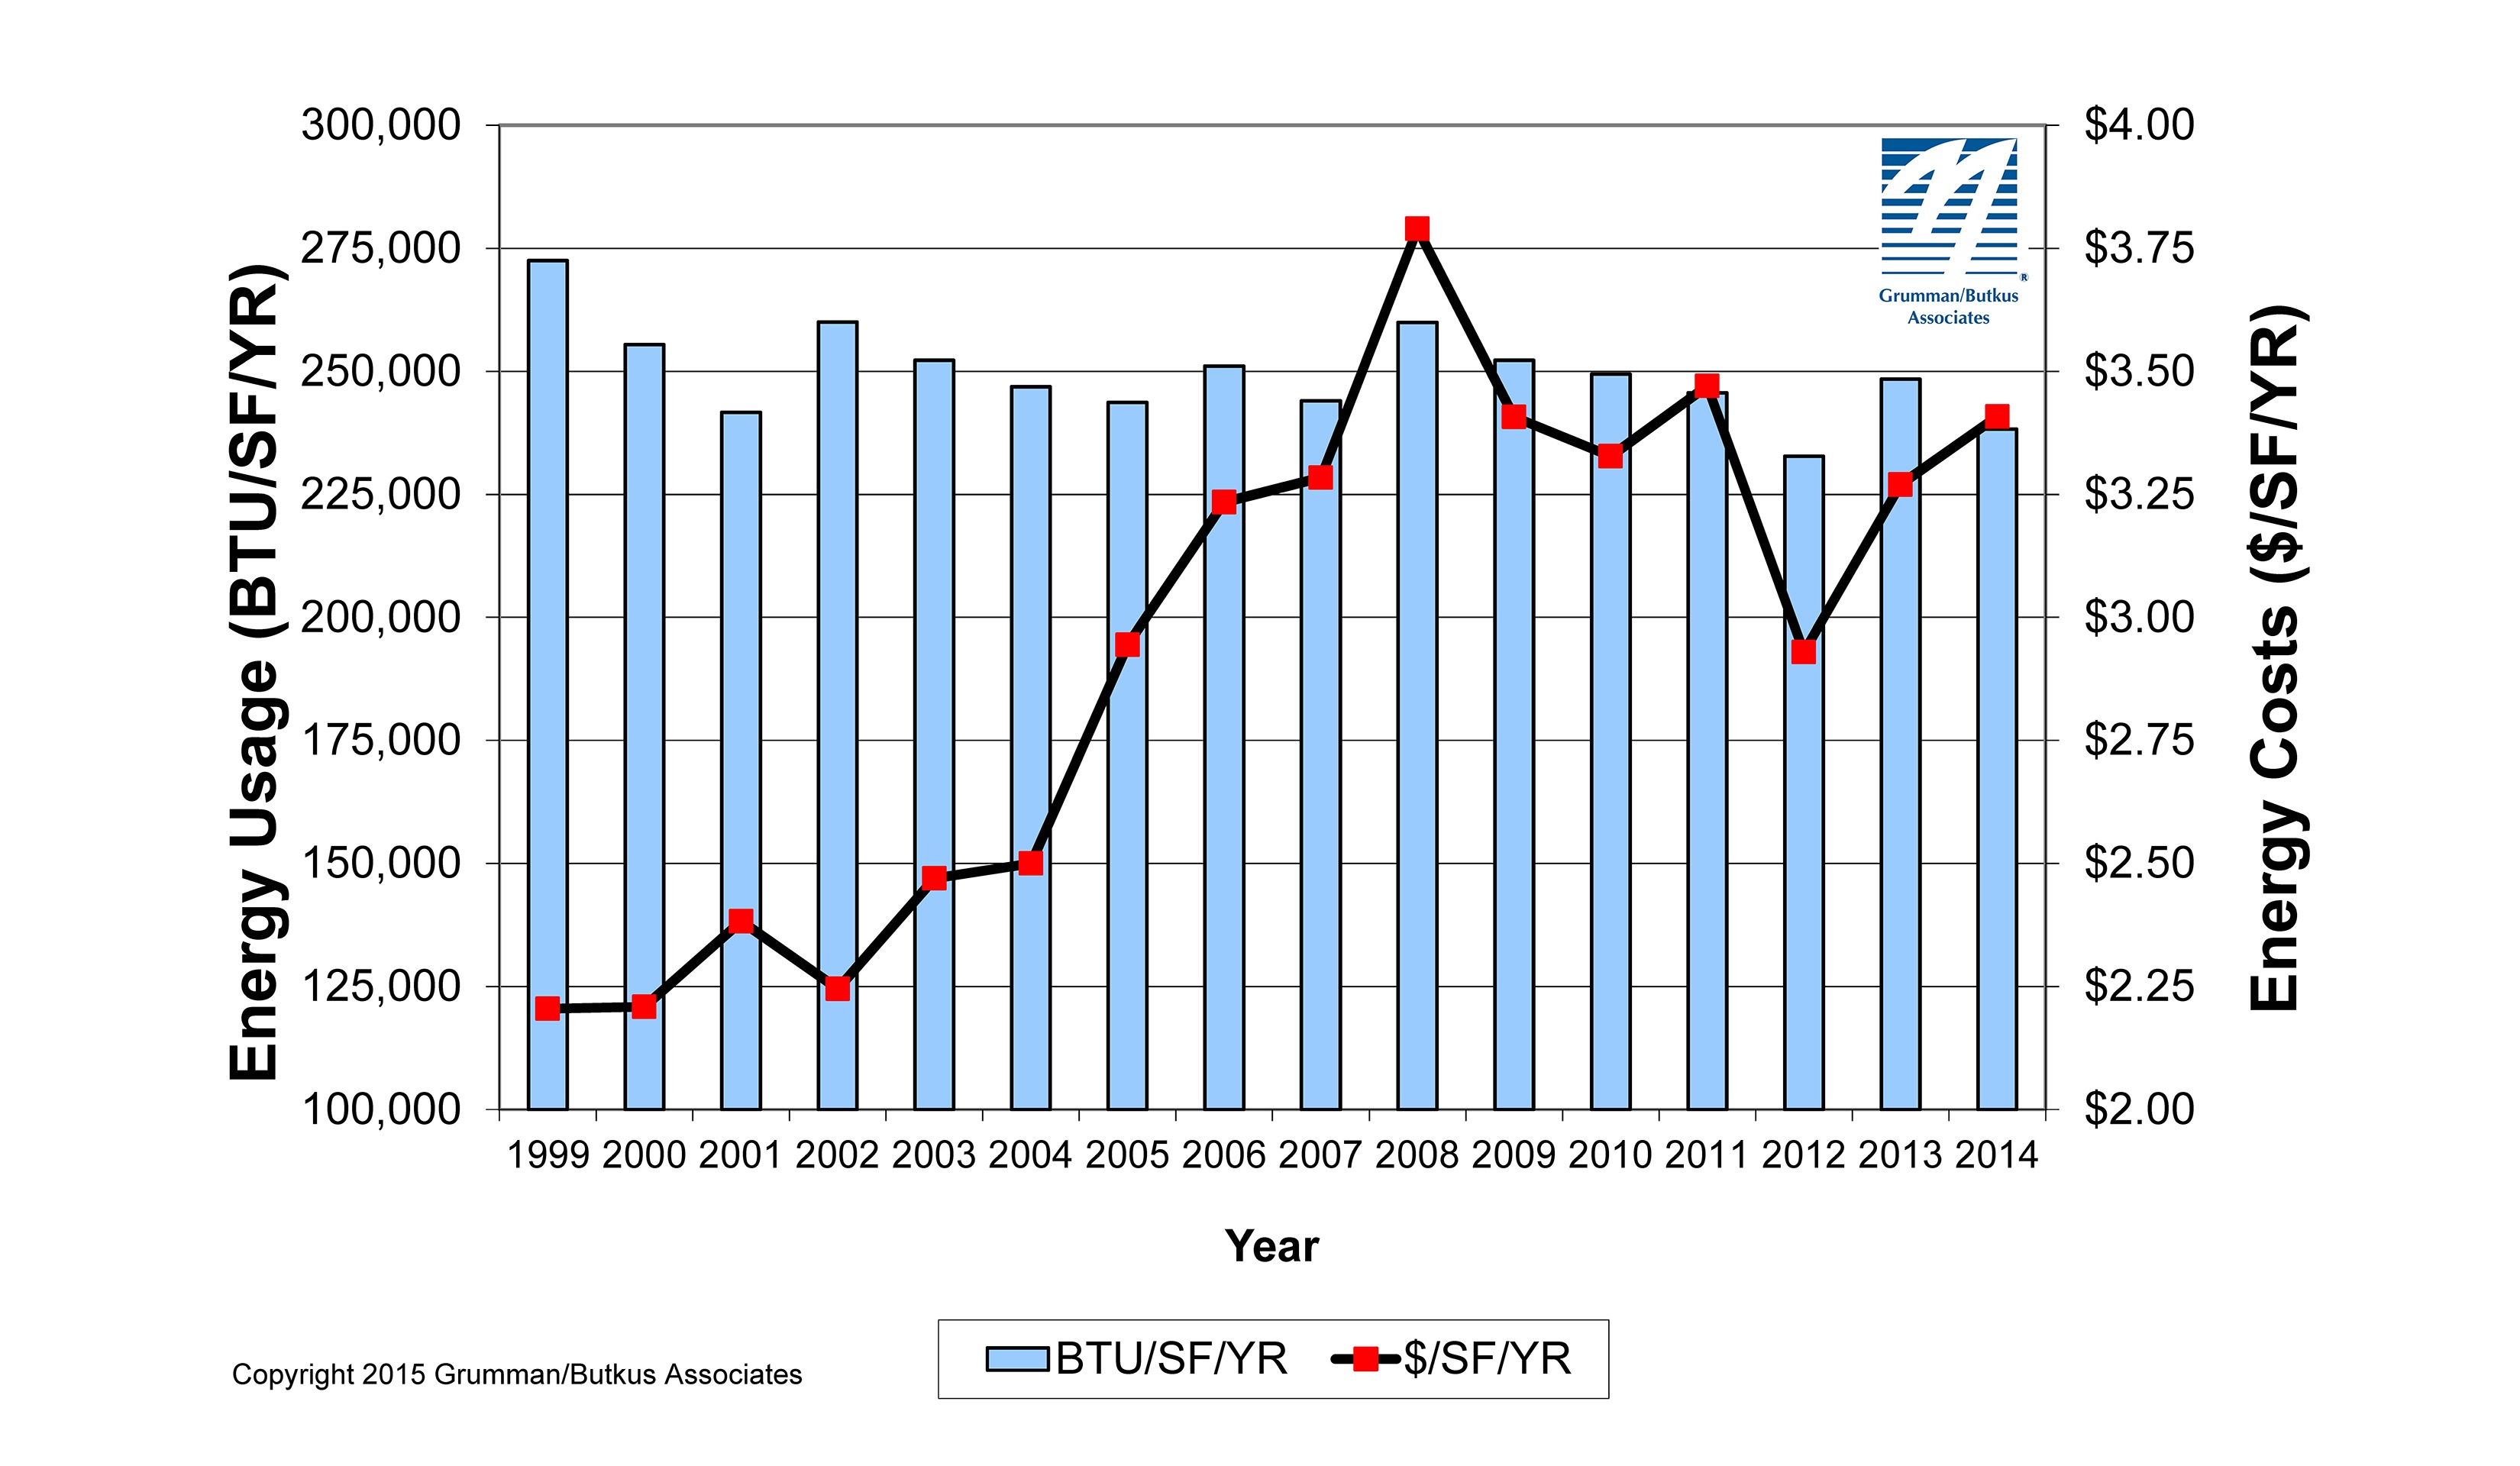
Since the survey was initiated 20 years ago, hospitals’ overall fossil fuel use has trended downward, but electricity use isn’t declining much. The average combined Btu/sf for facilities in the survey (electricity plus gas/steam) was 232,981 in CY2014, compared with 248,456 in the 2014 survey (CY2013). Harsher winter temperatures in 2012-13 compared with 2013-14 likely had something to do with the usage decline.
Square-foot prices for gas/steam were up year-to-year ($1.01 in 2013, vs. $1.16 in 2013), but square-foot prices for electricity fell ($2.26 in 2013 vs. $2.12 in 2014). The overall result of these usage and pricing patterns was that hospitals’ total sf costs for energy (gas/steam plus electric) hardly changed: $3.29 in CY2014, vs. $3.27 in CY2013.
Carbon footprint results have stayed fairly steady over time, at about 60 pounds of CO2 equivalent per ft2 per year, but have been slowly trending downward since 2010.
Reporting facilities displayed a range of usage patterns. For instance, some participants are using more than 200,000 BTU/ft2 in fossil fuel annually, compared with a general mid range of facilities (about 150,000 BTU/sf/year) and those that used least (100,000 BTU/sf/year). Similarly, a few hospitals consume more than 40 kWh/sf/year in electricity, compared with a mid-range of about 25 kWh/sf/year. A few squeaked by with less than 20 kWh/ft2.
“Hospitals are investing in efficiency measures and making progress, but have much further to go,” says G/BA Chairman Daniel L. Doyle. “Some of the low-hanging fruit is gone, but there are still many cost-effective opportunities remaining for reducing energy usage and costs.”
Hospital water use is also gradually declining, currently averaging about 49 gallons per square foot per year (compared with nearly 70 gallons/sf/year a decade ago). Costs per gallon are rising, however, now averaging $0.38/sf. As recently as 2007, hospitals were paying just $0.27/sf.
“The downward usage trend reflects a movement to eliminate city-water-cooled equipment, as well as the increased use of low-flow and occupancy-based plumbing fixtures,” says Doyle. “Water usage is an emerging issue. There is still much room for improvement.”
The G/BA survey has provided a free annual benchmarking resource since its initial release in 1995. Hospitals are invited to participate without charge by submitting responses to a short list of questions. Information for this edition was provided by 117 hospitals located in Illinois (56), Wisconsin (33), Michigan (5), Indiana (5), and seven other states.
Full results and analysis, as well as information about participating in the 2015 survey, are available at the firm’s website. For additional information, contact Doyle (ddoyle@grummanbutkus.com) or Julie Higginbotham (jhigginbotham@grummanbutkus.com).


