


Steep monthly declines in public and private nonresidential construction spending offset a surge in homebuilding in July, while industry employment decreased compared to July 2019 levels in two-thirds of the nation’s metro areas, according to an analysis by the Associated General Contractors of America of government data released today. Association officials said many commercial construction firms were likely to continue shedding jobs without needed federal coronavirus relief measures.
“The dichotomy between slumping nonresidential projects—both public and private—and robust homebuilding seems sure to widen as the pandemic continues to devastate state and local finances and much of the private sector,” said Ken Simonson, the association’s chief economist. “Without new federal investments in infrastructure and other measures to boost demand for nonresidential construction, contractors will be forced to let more workers go.”
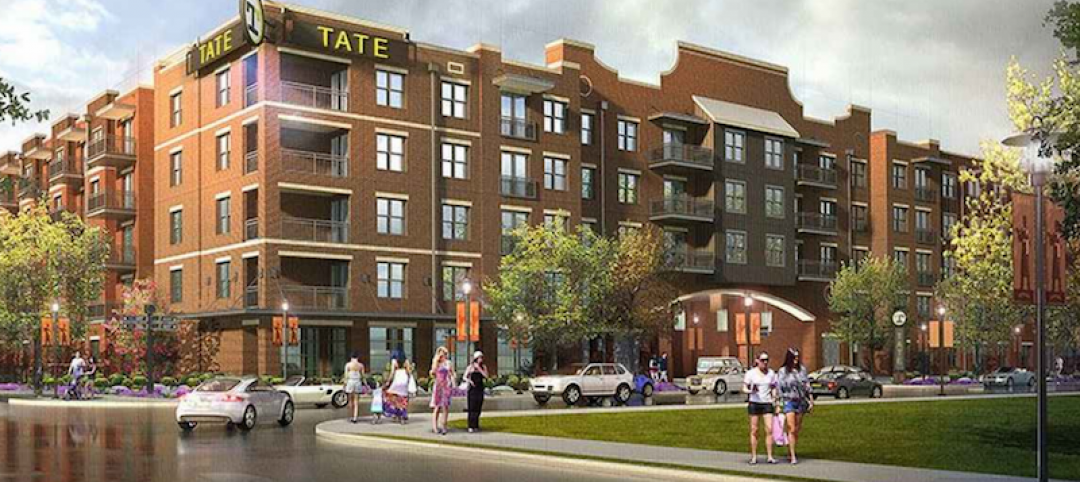
Construction spending in July totaled $1.36 trillion at a seasonally adjusted annual rate, a gain of 0.1% from June. A 1.2% drop in nonresidential spending nearly canceled out a 2.1% jump in residential spending, which was boosted by growth in both single-family (3.1%) and multifamily construction (4.9%).
Public construction spending decreased by 1.3%, dragged down by a 3.1% drop in highway and street construction spending and a 3.0% decline in educational construction spending, the two largest public segments. The next-largest segment, transportation facilities, also contracted, by 1.6 percent.
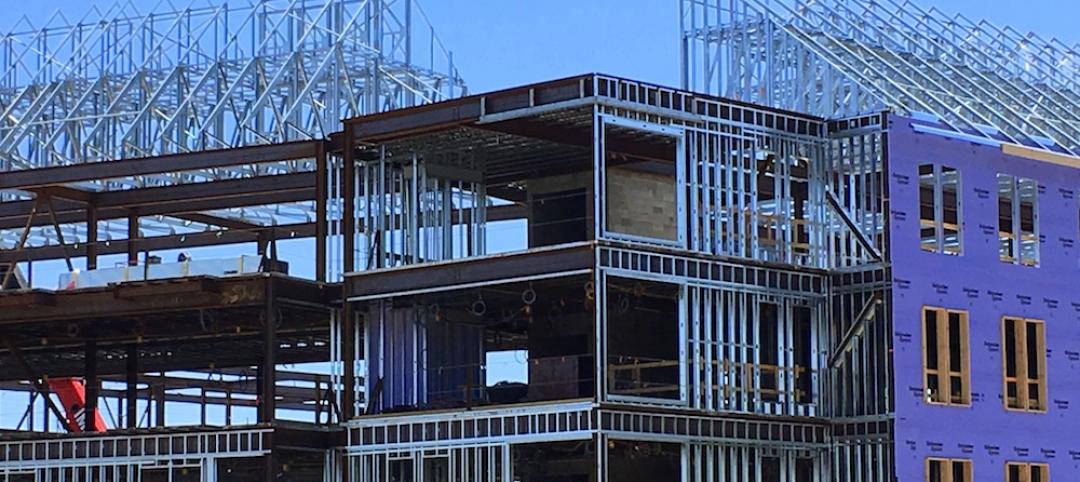
Private nonresidential construction spending slid 1.0% from June to July. The largest segment, power construction, dipped 0.1%. Among other large private spending categories, commercial construction—comprising retail, warehouse and farm structures—slumped 3.2%, while manufacturing construction rose 0.2% and office construction fell 0.7%.
Construction employment declined from July 2019 to July 2020 in 238, or 66%, out of 358 metro areas, increased in 90 areas (25%) and held steady in 30. New York City lost the most construction jobs (-26,500, -16%), while the steepest percentage loss occurred in Brockton-Bridgewater-Easton, Mass. (-36%, -2,100 jobs). Baltimore-Columbia-Towson, Md. added the most construction jobs over the year (4,800, 6%), while Walla Walla, Wash. had the largest percentage gain (25%, 300 jobs).
Association officials said that in addition to the new spending and metro employment data, the association is releasing the results of its annual workforce survey tomorrow that will underscore the need for new federal recovery measures. The construction officials called on Congress and the Trump administration to enact new infrastructure investments, pass a one-year extension to the current surface transportation law with additional transportation construction funding and enact liability reforms to shied firms that are protecting workers from the coronavirus from needless lawsuits.
“Without new federal relief measures, the industry’s limited recovery will likely be short lived,” said Stephen E. Sandherr, the association’s chief executive officer. “Congress and the President should be taking advantage of current market conditions to rebuild our infrastructure, restore lost jobs and reinvigorate the economy.”
View the metro employment data, rankings, highs and lows, and top 10.
Related Stories
Multifamily Housing | Aug 12, 2016
Apartment completions in largest metros on pace to increase by 50% in 2016
Texas is leading this multifamily construction boom, according to latest RENTCafé estimates.
Market Data | Jul 29, 2016
ABC: Output expands, but nonresidential fixed investment falters
Nonresidential fixed investment fell for a third consecutive quarter, as indicated by Bureau of Economic Analysis data.
Industry Research | Jul 26, 2016
AIA consensus forecast sees construction spending on rise through next year
But several factors could make the industry downshift.

Architects | Jul 20, 2016
AIA: Architecture Billings Index remains on solid footing
The June ABI score was down from May, but the figure was positive for the fifth consecutive month.

Market Data | Jul 7, 2016
Airbnb alleged to worsen housing crunch in New York City
Allegedly removing thousands of housing units from market, driving up rents.

Market Data | Jul 6, 2016
Construction spending falls 0.8% from April to May
The private and public sectors have a combined estimated seasonally adjusted annual rate of $1.14 trillion.
Market Data | Jul 6, 2016
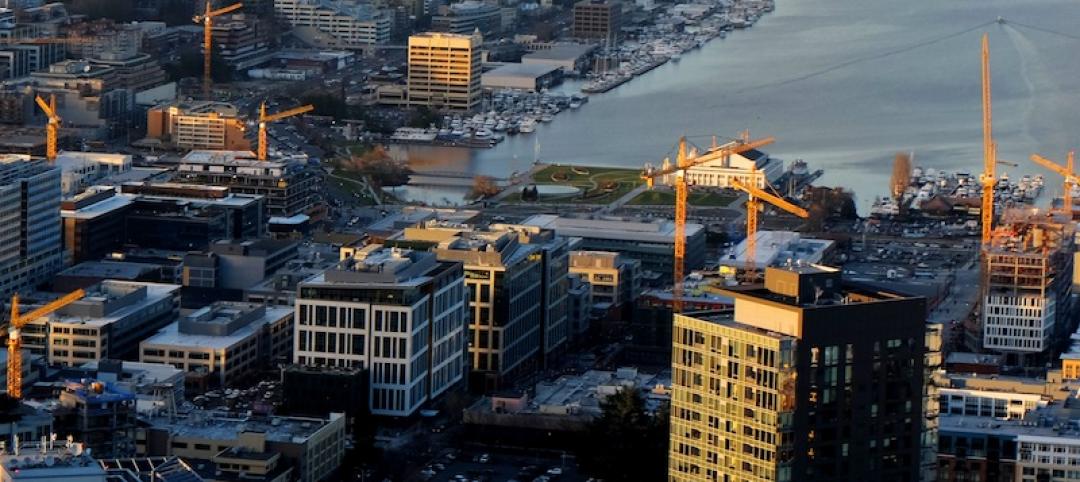
A thriving economy and influx of businesses spur construction in downtown Seattle
Development investment is twice what it was five years ago.

Multifamily Housing | Jul 5, 2016
Apartments continue to shrink, rents continue to rise
Latest survey by RENTCafé tracks size changes in 95 metros.
Multifamily Housing | Jun 22, 2016
Can multifamily construction keep up with projected demand?
The Joint Center for Housing Studies’ latest disection of America’s housing market finds moderate- and low-priced rentals in short supply.
Contractors | Jun 21, 2016
Bigness counts when it comes to construction backlogs
Large companies that can attract talent are better able to commit to more work, according to a national trade group for builders and contractors.


