


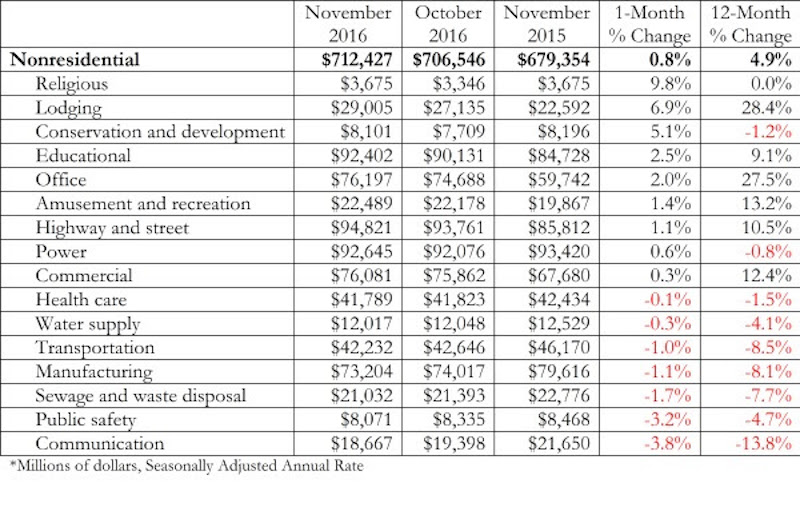
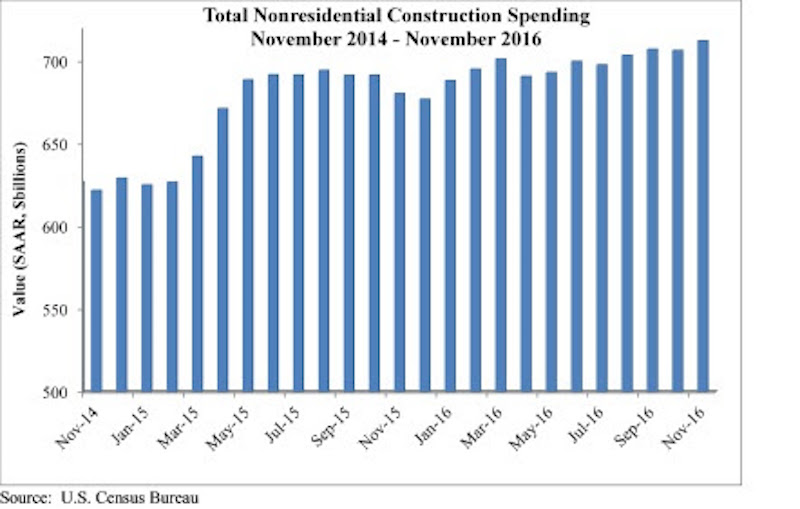
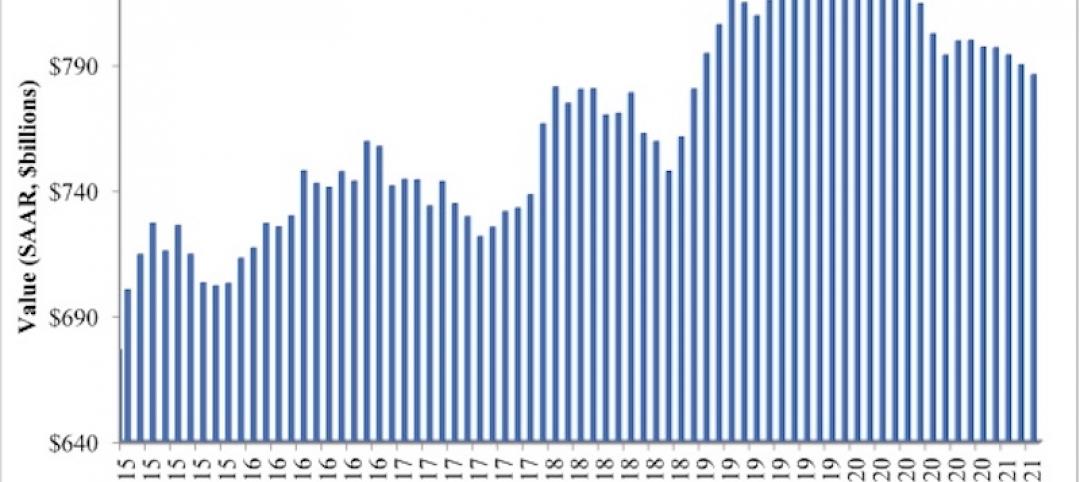
Nonresidential construction surged in November, according to analysis of U.S. Census Bureau data released by Associated Builders and Contractors (ABC). Nonresidential spending expanded to $712.4 billion on a seasonally adjusted, annualized rate in November, representing the highest level of spending in eight years.
October’s figure was upwardly revised by 1 percent (from $699.7 billion to $706.5 billion), while September’s figure was upwardly revised by 0.8 percent (from $701.7 billion to $707.2 billion). A bit more than half of the 16 subsectors experienced spending increases in November.
“Nonresidential construction spending is up approximately 5 percent on a year-over-year basis, and momentum should build further,” says ABC Chief Economist Anirban Basu in a press release. ““If the last few weeks are any indication, the 2017 economy will be associated with tax cuts, more government spending, less financial regulation, faster economic growth, a stronger U.S. dollar, robust stock market performance and greater overall CEO confidence. That should translate into improved construction spending moving forward.”
A stronger U.S. dollar, larger budget deficits, and rising interest rates could shrink U.S. exports and serve to suppress U.S. economic dynamism, but the current nonresidential construction outlook is promising, according to Basu.
Related Stories
Market Data | Jun 16, 2021
Construction input prices rise 4.6% in May; softwood lumber prices up 154% from a year ago
Construction input prices are 24.3% higher than a year ago, while nonresidential construction input prices increased 23.9% over that span.

Market Data | Jun 16, 2021
Producer prices for construction materials and services jump 24% over 12 months
The 24.3% increase in prices for materials used in construction from May 2020 to last month was nearly twice as great as in any previous year
Market Data | Jun 15, 2021
ABC’s Construction Backlog inches higher in May
Materials and labor shortages suppress contractor confidence.
Market Data | Jun 11, 2021
The countries with the most green buildings
As the country that set up the LEED initiative, the US is a natural leader in constructing green buildings.
Market Data | Jun 7, 2021
Construction employment slips by 20,000 in May
Seasonally adjusted construction employment in May totaled 7,423,000.
Market Data | Jun 2, 2021
Construction employment in April lags pre-covid February 2020 level in 107 metro areas
Houston-The Woodlands-Sugar Land and Odessa, Texas have worst 14-month construction job losses.
Market Data | Jun 1, 2021
Nonresidential construction spending decreases 0.5% in April
Spending was down on a monthly basis in nine of 16 nonresidential subcategories.
Market Data | Jun 1, 2021
Nonresidential construction outlays drop in April to two-year low
Public and private work declines amid supply-chain woes, soaring costs.
Market Data | May 24, 2021
Construction employment in April remains below pre-pandemic peak in 36 states and D.C.
Texas and Louisiana have worst job losses since February 2020, while Utah and Idaho are the top gainers.
Market Data | May 19, 2021
Design activity strongly increases
Demand signals construction is recovering.


