


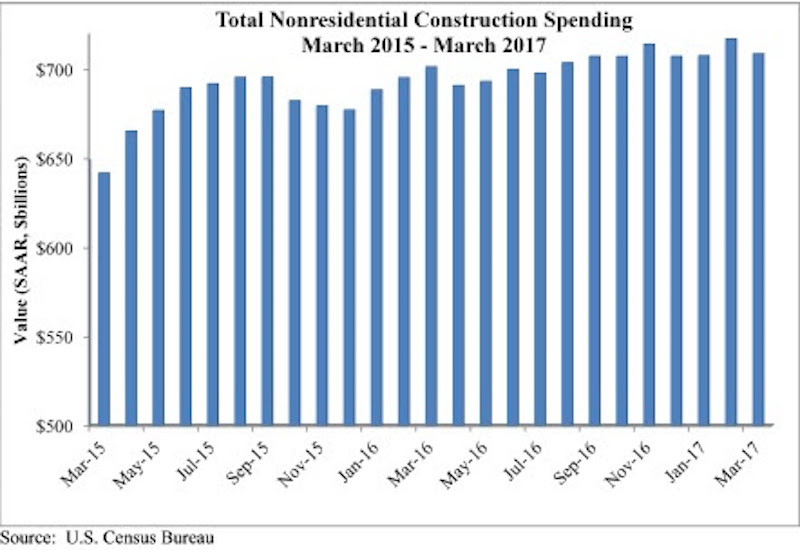
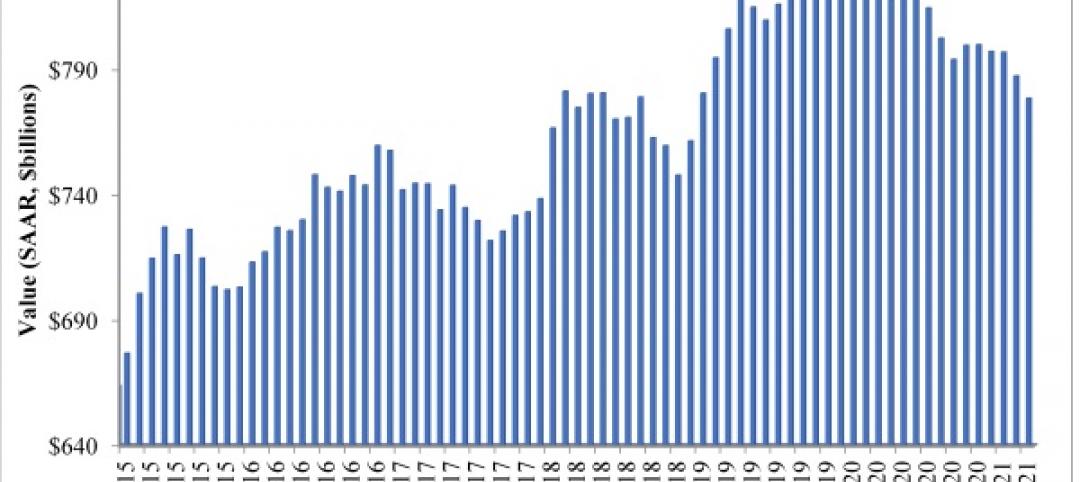
Nonresidential construction spending fell 1.2 percent in March, according to analysis of U.S. Census Bureau data recently released by Associated Builders and Contractors (ABC). Spending in the segment totaled $708.6 billion on a seasonally adjusted, annualized basis, however the decline is less dramatic than it may be perceived to be given that February’s initial estimate of $701.6 billion was upwardly revised to $717 billion, making it the highest level or spending recorded in the data series.
In March, private nonresidential construction spending fell 1.3 percent for the month, but remains up 6.4 percent on a year-ago basis. Public nonresidential spending decreased by 0.9 percent and is down 6.5 percent year over year. Were it not for the manufacturing subsector, where spending has contracted 9.7 percent from the same time last year, overall spending would have increased from February and set a new record high for construction spending.
“There are at least two tales to tell, and neither one of them is particularly uplifting,” said ABC Chief Economist Anirban Basu. “One narrative relates to public spending, which remains soft. Even categories in which one might have expected spending growth have not experienced an increase over past year. For instance, one might have anticipated stepped-up spending in the water supply category given the events in Flint, Mich. But spending in that category is down by roughly 14 percent over the past year. Similarly, one might have predicted spending increases in the highway and street category since the Fixing America’s Surface Transportation Act was passed in December 2015. However, spending in that category is down 2.4 percent on a year-over-year basis.
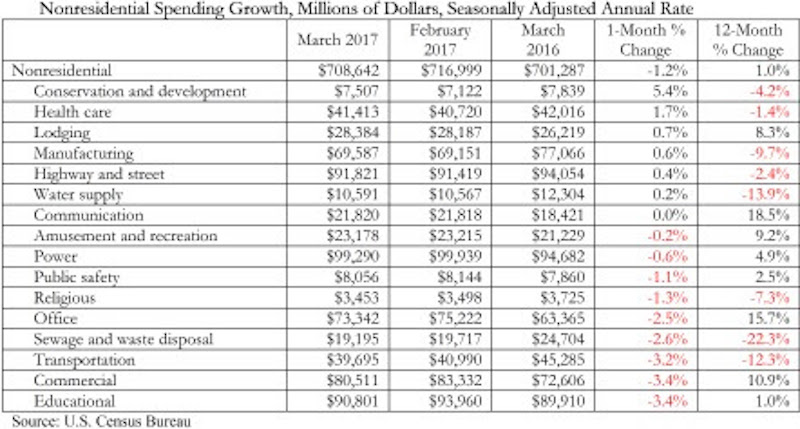
“Private construction spending has lost momentum as well, perhaps because developers and their financiers are becoming increasingly unnerved by the possibility of mini-bubbles in certain commercial real estate segments,” said Basu. “Many investors may also have adopted a wait-and-see attitude regarding policies coming out of Washington, D.C., including those related to proposed tax reform and infrastructure spending initiatives. Perhaps as a result, office and commercial-related construction spending declined in March. Still, other data suggest lingering momentum in various privately-financed segments, and data from the most recent GDP report indicate that investors continue to invest aggressively in structures. It is for this reason that today’s construction spending release is at least somewhat surprising with respect to private investment in structures. An upward revision to today’s data may be forthcoming.
“Looking ahead, all eyes are on Washington, D.C,” said Basu. “A pro-business agenda remains in the works, but little of it has been implemented thus far. Financial markets continue to express confidence regarding the ultimate execution of significant portions of this agenda, but if it remains bogged down politically, market confidence will wane and private construction spending will continue to be erratic.”
Related Stories

Multifamily Housing | May 18, 2021
Multifamily housing sector sees near record proposal activity in early 2021
The multifamily sector led all housing submarkets, and was third among all 58 submarkets tracked by PSMJ in the first quarter of 2021.
Market Data | May 18, 2021
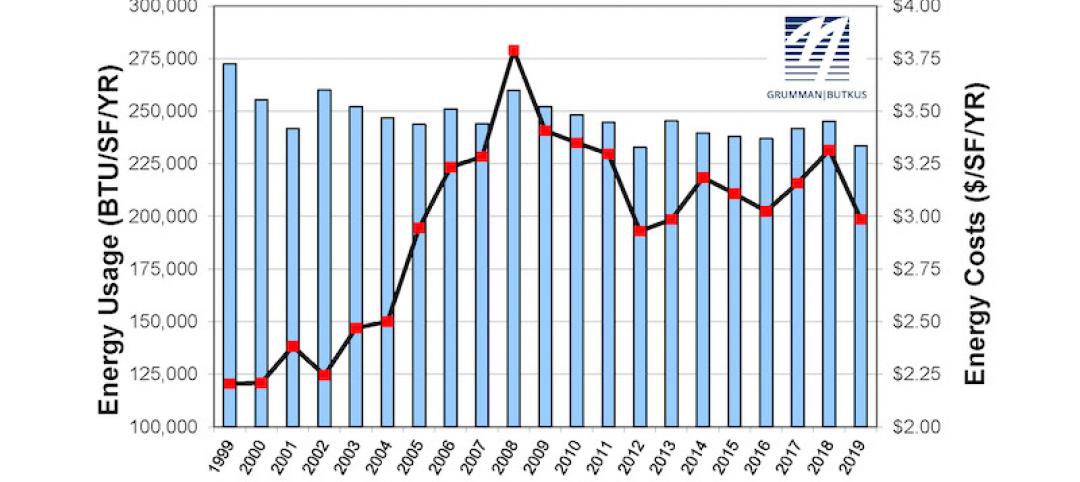
Grumman|Butkus Associates publishes 2020 edition of Hospital Benchmarking Survey
The report examines electricity, fossil fuel, water/sewer, and carbon footprint.
Market Data | May 13, 2021
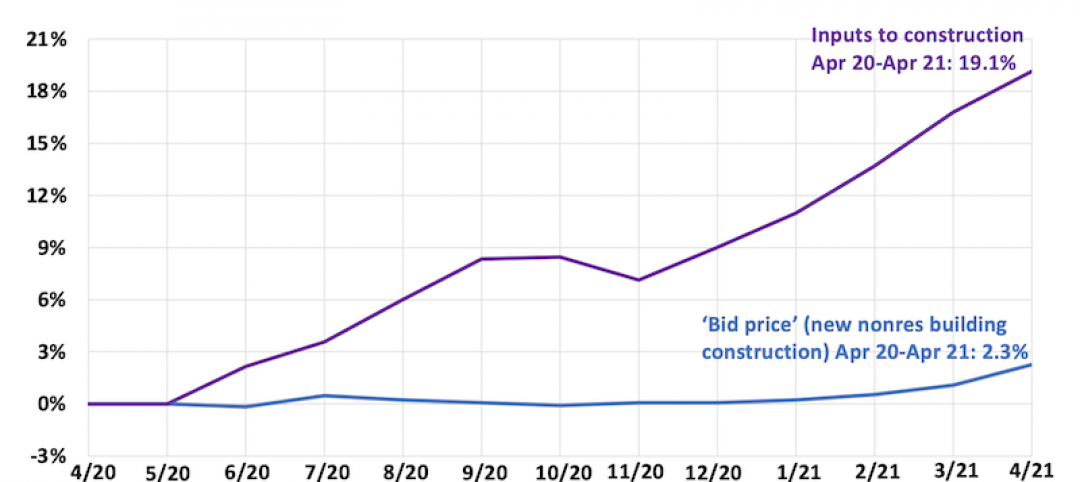
Proliferating materials price increases and supply chain disruptions squeeze contractors and threaten to undermine economic recovery
Producer price index data for April shows wide variety of materials with double-digit price increases.
Market Data | May 7, 2021
Construction employment stalls in April
Soaring costs, supply-chain challenges, and workforce shortages undermine industry's recovery.
Market Data | May 4, 2021
Nonresidential construction outlays drop in March for fourth-straight month
Weak demand, supply-chain woes make further declines likely.
Market Data | May 3, 2021
Nonresidential construction spending decreases 1.1% in March
Spending was down on a monthly basis in 11 of the 16 nonresidential subcategories.

Market Data | Apr 30, 2021
New York City market continues to lead the U.S. Construction Pipeline
New York City has the greatest number of projects under construction with 110 projects/19,457 rooms.

Market Data | Apr 29, 2021
U.S. Hotel Construction pipeline beings 2021 with 4,967 projects/622,218 rooms at Q1 close
Although hotel development may still be tepid in Q1, continued government support and the extension of programs has aided many businesses to get back on their feet as more and more are working to re-staff and re-open.
Market Data | Apr 28, 2021
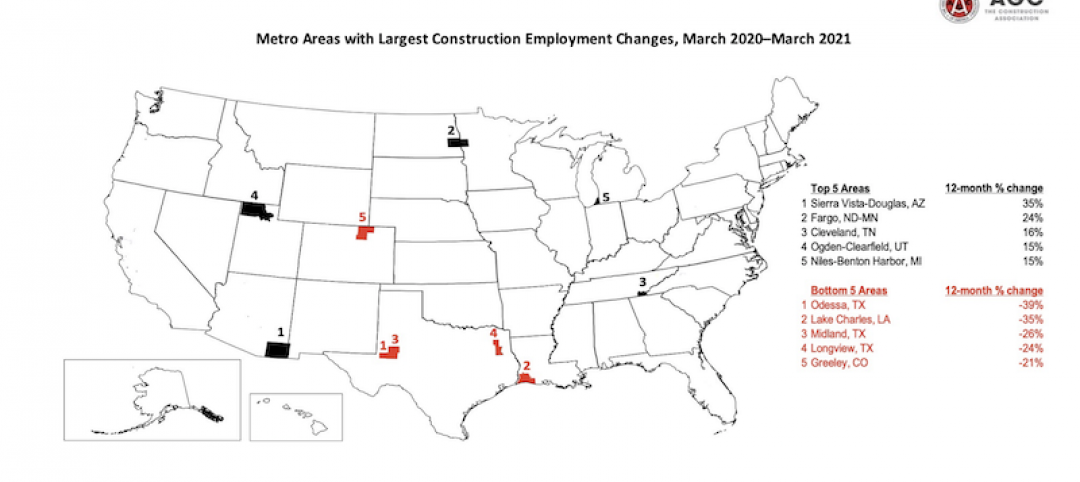
Construction employment declines in 203 metro areas from March 2020 to March 2021
The decline occurs despite homebuilding boom and improving economy.
Market Data | Apr 20, 2021
The pandemic moves subs and vendors closer to technology
Consigli’s latest market outlook identifies building products that are high risk for future price increases.


