


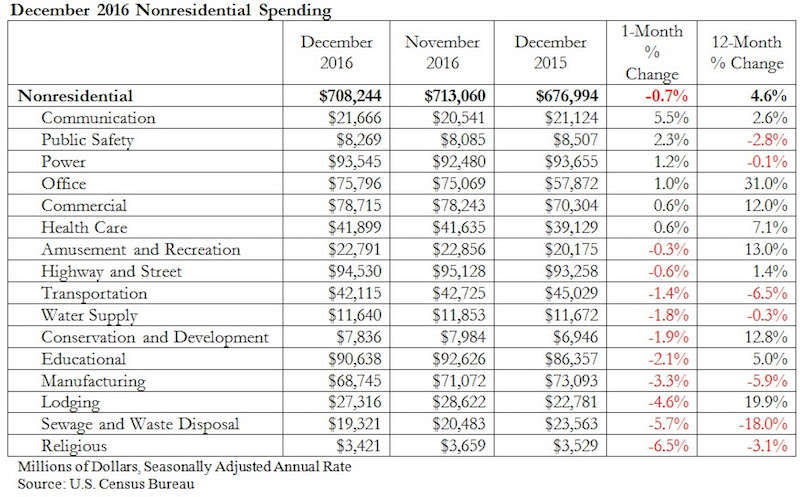
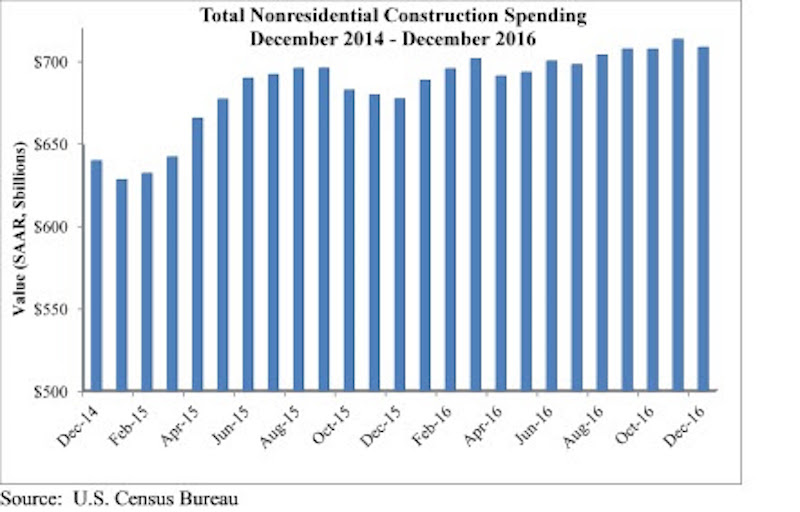
Nonresidential construction spending slipped 0.7 percent in the final month of 2016, but increased 4.6 percent over the previous year, according to analysis of U.S. Census Bureau data recently released by Associated Builders and Contractors (ABC). Nonresidential spending decreased from $713.1 billion in November to $708.2 billion in December on a seasonally adjusted, annualized basis.
Both November’s estimate ($713.1 billion) and October’s estimate ($707.1 billion) were upwardly revised by less than one-tenth of a percent. Private nonresidential spending remained flat for the month, while public nonresidential spending contracted 1.7 percent.
“Private spending growth, which has led nonresidential spending growth for months, remained flat in December and, as a result, the preexisting story of the industry remains fundamentally unchanged,” said ABC Chief Economist Anirban Basu in a release. “Public construction spending has been soft for many years and the December spending data merely served to extend that part of the tale. Spending in the sewage and waste disposal, transportation, and public safety sectors was particularly weak during the past 12 months. Private spending growth has been on-again, off-again for much of the year, so it is not a surprise that last month’s robust spending report was followed by a flat one.
“On the bright side, the architectural community became much busier in December, signaling an acceleration of commercial activity to come,” said Basu. “In addition, the new administration appears committed to fulfilling its campaign promises, including a pledge to step up infrastructure spending. This has asphalt, pavement and other infrastructure-intensive contractors expressing more confidence in their economic future than they have for many years. As such, the December data provide little insight into the future trajectory of nonresidential construction spending, which is set to improve markedly during the next six to 12 months.”
Related Stories

Market Data | Apr 11, 2023
Construction crane count reaches all-time high in Q1 2023
Toronto, Seattle, Los Angeles, and Denver top the list of U.S/Canadian cities with the greatest number of fixed cranes on construction sites, according to Rider Levett Bucknall's RLB Crane Index for North America for Q1 2023.

Contractors | Apr 11, 2023
The average U.S. contractor has 8.7 months worth of construction work in the pipeline, as of March 2023
Associated Builders and Contractors reported that its Construction Backlog Indicator declined to 8.7 months in March, according to an ABC member survey conducted March 20 to April 3. The reading is 0.4 months higher than in March 2022.

Market Data | Apr 6, 2023
JLL’s 2023 Construction Outlook foresees growth tempered by cost increases
The easing of supply chain snags for some product categories, and the dispensing with global COVID measures, have returned the North American construction sector to a sense of normal. However, that return is proving to be complicated, with the construction industry remaining exceptionally busy at a time when labor and materials cost inflation continues to put pricing pressure on projects, leading to caution in anticipation of a possible downturn. That’s the prognosis of JLL’s just-released 2023 U.S. and Canada Construction Outlook.

Market Data | Apr 4, 2023
Nonresidential construction spending up 0.4% in February 2023
National nonresidential construction spending increased 0.4% in February, according to an Associated Builders and Contractors analysis of data published by the U.S. Census Bureau. On a seasonally adjusted annualized basis, nonresidential spending totaled $982.2 billion for the month, up 16.8% from the previous year.

Multifamily Housing | Mar 24, 2023
Average size of new apartments dropped sharply in 2022
The average size of new apartments in 2022 dropped sharply in 2022, as tracked by RentCafe. Across the U.S., the average new apartment size was 887 sf, down 30 sf from 2021, which was the largest year-over-year decrease.

Multifamily Housing | Mar 14, 2023
Multifamily housing rent rates remain flat in February 2023
Multifamily housing asking rents remained the same for a second straight month in February 2023, at a national average rate of $1,702, according to the new National Multifamily Report from Yardi Matrix. As the economy continues to adjust in the post-pandemic period, year-over-year growth continued its ongoing decline.

Contractors | Mar 14, 2023
The average U.S. contractor has 9.2 months worth of construction work in the pipeline, as of February 2023
Associated Builders and Contractors reported today that its Construction Backlog Indicator increased to 9.2 months in February, according to an ABC member survey conducted Feb. 20 to March 6. The reading is 1.2 months higher than in February 2022.

Industry Research | Mar 9, 2023
Construction labor gap worsens amid more funding for new infrastructure, commercial projects
The U.S. construction industry needs to attract an estimated 546,000 additional workers on top of the normal pace of hiring in 2023 to meet demand for labor, according to a model developed by Associated Builders and Contractors. The construction industry averaged more than 390,000 job openings per month in 2022.

Market Data | Mar 7, 2023
AEC employees are staying with firms that invest in their brand
Hinge Marketing’s latest survey explores workers’ reasons for leaving, and offers strategies to keep them in the fold.

Multifamily Housing | Feb 21, 2023
Multifamily housing investors favoring properties in the Sun Belt
Multifamily housing investors are gravitating toward Sun Belt markets with strong job and population growth, according to new research from Yardi Matrix. Despite a sharp second-half slowdown, last year’s nationwide $187 billion transaction volume was the second-highest annual total ever.


