

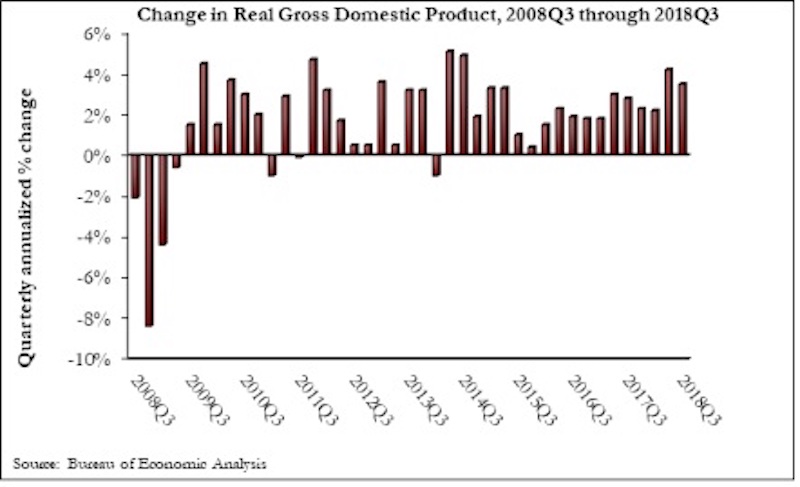
The U.S. economy expanded at a 3.5% annualized rate during the third quarter of 2018, according to an Associated Builders and Contractors analysis of U.S. Bureau of Economic Analysis data released today. This represents the first time there have been two consecutive quarters of 3%-plus growth since the beginning of 2015.
Despite the broader economic growth, fixed investment inched 0.3% lower in the third quarter. Nonresidential fixed investment increased at just a 0.8% annualized rate, a stark reversal from the 11.5% and 8.7% growth observed in the first and second quarters, respectively. Investment in structures plummeted 7.9% after increasing by 13.9% and 14.5% in the previous two quarters.
“While the GDP increased, business investment, including investment in structures, was generally disappointing,” said ABC Chief Economist Anirban Basu. “Today’s GDP release is consistent with other data indicating a recent softening in capital expenditures, which caught many observers by surprise. Coming into the year, the expectation among many was that corporate tax cuts would translate into a lengthy period of rising business investment.
“As always, there are multiple explanations for the observed slowing in capital expenditures,” said Basu. “The first is simply that this represents an inevitable moderation in fixed business investment after the stunning growth in investment registered during the year’s initial two quarters. A second explanation, however, is not nearly as benign. This explanation focuses on both the growing constraints that businesses face due to a lack of trained workers available to work on new equipment, as well as the impact of rising input costs. Corporate earnings are no longer as consistently surprising to the upside, an indication of the impact of rising business costs. It may be that the dislocation created by ongoing trade skirmishes is also inducing certain firms to invest less in equipment and structures.
“If the first explanation is correct, one would expect a bounce back in capital expenditures,” said Basu. “The logic is that the U.S. business community has taken a bit of a breather to digest all of the capital investments undertaken during the first half of 2018. However, the second would indicate economic growth and the pace of hiring to soften in 2019. That obviously would not be a welcome dynamic for America’s construction sector.”

Related Stories

Hotel Facilities | Jan 22, 2024
U.S. hotel construction is booming, with a record-high 5,964 projects in the pipeline
The hotel construction pipeline hit record project counts at Q4, with the addition of 260 projects and 21,287 rooms over last quarter, according to Lodging Econometrics.

Multifamily Housing | Jan 15, 2024
Multifamily rent growth rate unchanged at 0.3%
The National Multifamily Report by Yardi Matrix highlights the highs and lows of the multifamily market in 2023. Despite strong demand, rent growth remained unchanged at 0.3 percent.

Self-Storage Facilities | Jan 5, 2024
The state of self-storage in early 2024
As the housing market cools down, storage facilities suffer from lower occupancy and falling rates, according to the December 2023 Yardi Matrix National Self Storage Report.

Designers | Dec 25, 2023
Redefining the workplace is a central theme in Gensler’s latest Design Report
The firm identifies eight mega trends that mostly stress human connections.

Contractors | Dec 12, 2023
The average U.S. contractor has 8.5 months worth of construction work in the pipeline, as of November 2023
Associated Builders and Contractors reported today that its Construction Backlog Indicator inched up to 8.5 months in November from 8.4 months in October, according to an ABC member survey conducted Nov. 20 to Dec. 4. The reading is down 0.7 months from November 2022.

Market Data | Nov 27, 2023
Number of employees returning to the office varies significantly by city
While the return-to-the-office trend is felt across the country, the percentage of employees moving back to their offices varies significantly according to geography, according to Eptura’s Q3 Workplace Index.

Market Data | Nov 14, 2023
The average U.S. contractor has 8.4 months worth of construction work in the pipeline, as of September 2023
Associated Builders and Contractors reported that its Construction Backlog Indicator declined to 8.4 months in October from 9.0 months in September, according to an ABC member survey conducted from Oct. 19 to Nov. 2. The reading is down 0.4 months from October 2022. Backlog now stands at its lowest level since the first quarter of 2022.

Multifamily Housing | Nov 9, 2023
Multifamily project completions forecast to slow starting 2026
Yardi Matrix has released its Q4 2023 Multifamily Supply Forecast, emphasizing a short-term spike and plateau of new construction.

Contractors | Nov 1, 2023
Nonresidential construction spending increases for the 16th straight month, in September 2023
National nonresidential construction spending increased 0.3% in September, according to an Associated Builders and Contractors analysis of data published today by the U.S. Census Bureau. On a seasonally adjusted annualized basis, nonresidential spending totaled $1.1 trillion.

Market Data | Oct 23, 2023
New data finds that the majority of renters are cost-burdened
The most recent data derived from the 2022 Census American Community Survey reveals that the proportion of American renters facing housing cost burdens has reached its highest point since 2012, undoing the progress made in the ten years leading up to the pandemic.


