


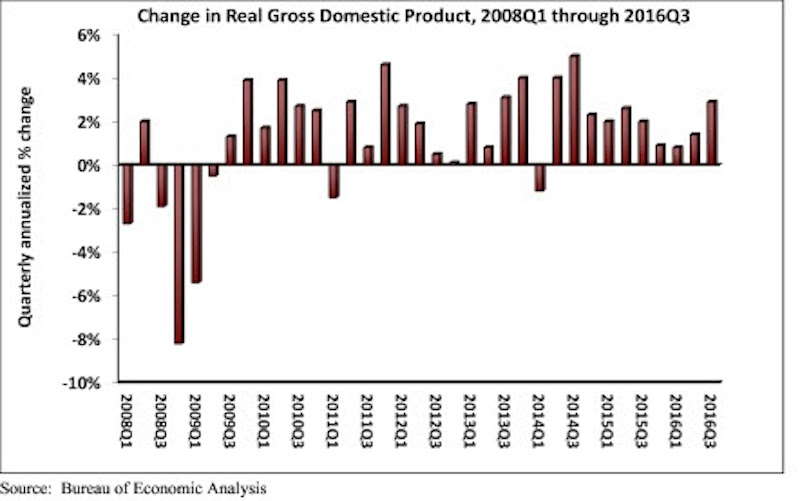
Real gross domestic product (GDP) expanded 2.9 percent on a seasonally adjusted annualized rate during the third quarter of 2016, according to an analysis of Bureau of Economic Analysis data released today by Associated Builders and Contractors (ABC). This follows a 1.4 percent increase during the second quarter and represents the tenth consecutive quarter of economic expansion.
Nonresidential fixed investment, a category closely aligned with construction and other forms of business investment, expanded at a 1.2 percent annualized rate during the third quarter after growing 1 percent during the second. Investment in structures led the way, increasing by 5.4 percent in the third quarter after falling 2.1 percent during the second. Investment in equipment fell 2.7 percent for the quarter, while investment in intellectual property products expanded 4 percent. Residential investment continued to fall, declining 6.2 percent in the third quarter after falling 7.7 percent during the second.
The following highlights emerged from today’s third quarter GDP release. All growth figures are presented as seasonally adjusted annualized rates:
- Personal consumption expenditures expanded 2.1 percent on an annualized basis during the third quarter of 2016 after growing 4.3 percent during the second quarter of 2016.
- Spending on goods rose 2.2 percent during the third quarter after expanding by 7.1 percent during the previous quarter.
- Real final sales of domestically produced output increased 2.3 percent in the third quarter after increasing 2.6 percent in the second.
- Federal government spending expanded 2.5 percent in the year’s third quarter after contracting during each of the prior two quarters.
- Nondefense government spending increased 3 percent during the quarter following an increase of 3.8 percent during the second.
- National defense spending grew by 2.1 percent during the third quarter after registering a 3.2 percent decline in the previous quarter.
- State and local government spending fell by 0.7 percent in the third quarter after falling 2.5 percent in the second quarter.
“The acceleration in real GDP growth was driven by a combination of factors, including an upturn in exports, a smaller decrease in state and local government spending and an upturn in federal government spending. One of the biggest impacts came from greater private inventory investment, likely in response to expectations for reasonably strong consumer spending. Growth in personal consumption expenditures was responsible for almost half of third quarter GDP growth. However, this build in inventories is likely to subtract from economic growth in future quarters, though not massively,” says ABC Chief Economist Anirban Basu.
“Third quarter growth was solid, but future quarters may not be as good,” Basu says. “The economy will have to deal with a number of headwinds going forward, including a stronger dollar, building inflationary pressures and higher interest rates. Consumer spending growth will continue to lead the recovery. While this will help support construction spending in certain categories, including distribution centers, nonresidential investment in structures is likely to expand only slowly in early 2017.”
Related Stories

Apartments | Aug 22, 2023
Key takeaways from RCLCO's 2023 apartment renter preferences study
Gregg Logan, Managing Director of real estate consulting firm RCLCO, reveals the highlights of RCLCO's new research study, “2023 Rental Consumer Preferences Report.” Logan speaks with BD+C's Robert Cassidy.

Market Data | Aug 18, 2023
Construction soldiers on, despite rising materials and labor costs
Quarterly analyses from Skanska, Mortenson, and Gordian show nonresidential building still subject to materials and labor volatility, and regional disparities.

Apartments | Aug 14, 2023
Yardi Matrix updates near-term multifamily supply forecast
The multifamily housing supply could increase by up to nearly 7% by the end of 2023, states the latest Multifamily Supply Forecast from Yardi Matrix.

Hotel Facilities | Aug 2, 2023
Top 5 markets for hotel construction
According to the United States Construction Pipeline Trend Report by Lodging Econometrics (LE) for Q2 2023, the five markets with the largest hotel construction pipelines are Dallas with a record-high 184 projects/21,501 rooms, Atlanta with 141 projects/17,993 rooms, Phoenix with 119 projects/16,107 rooms, Nashville with 116 projects/15,346 rooms, and Los Angeles with 112 projects/17,797 rooms.

Market Data | Aug 1, 2023
Nonresidential construction spending increases slightly in June
National nonresidential construction spending increased 0.1% in June, according to an Associated Builders and Contractors analysis of data published today by the U.S. Census Bureau. Spending is up 18% over the past 12 months. On a seasonally adjusted annualized basis, nonresidential spending totaled $1.07 trillion in June.

Hotel Facilities | Jul 27, 2023
U.S. hotel construction pipeline remains steady with 5,572 projects in the works
The hotel construction pipeline grew incrementally in Q2 2023 as developers and franchise companies push through short-term challenges while envisioning long-term prospects, according to Lodging Econometrics.

Hotel Facilities | Jul 26, 2023
Hospitality building construction costs for 2023
Data from Gordian breaks down the average cost per square foot for 15-story hotels, restaurants, fast food restaurants, and movie theaters across 10 U.S. cities: Boston, Chicago, Las Vegas, Los Angeles, Miami, New Orleans, New York, Phoenix, Seattle, and Washington, D.C.

Market Data | Jul 24, 2023
Leading economists call for 2% increase in building construction spending in 2024
Following a 19.7% surge in spending for commercial, institutional, and industrial buildings in 2023, leading construction industry economists expect spending growth to come back to earth in 2024, according to the July 2023 AIA Consensus Construction Forecast Panel.

Contractors | Jul 13, 2023
Construction input prices remain unchanged in June, inflation slowing
Construction input prices remained unchanged in June compared to the previous month, according to an Associated Builders and Contractors analysis of U.S. Bureau of Labor Statistics Producer Price Index data released today. Nonresidential construction input prices were also unchanged for the month.

Contractors | Jul 11, 2023
The average U.S. contractor has 8.9 months worth of construction work in the pipeline, as of June 2023
Associated Builders and Contractors reported that its Construction Backlog Indicator remained unchanged at 8.9 months in June 2023, according to an ABC member survey conducted June 20 to July 5. The reading is unchanged from June 2022.


