


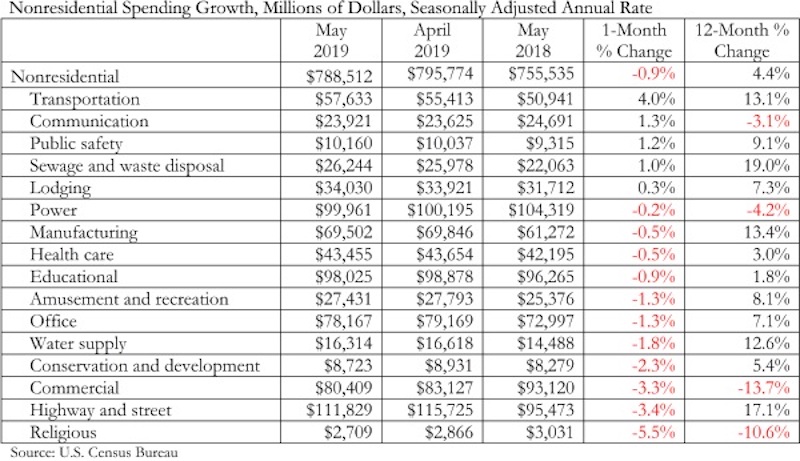
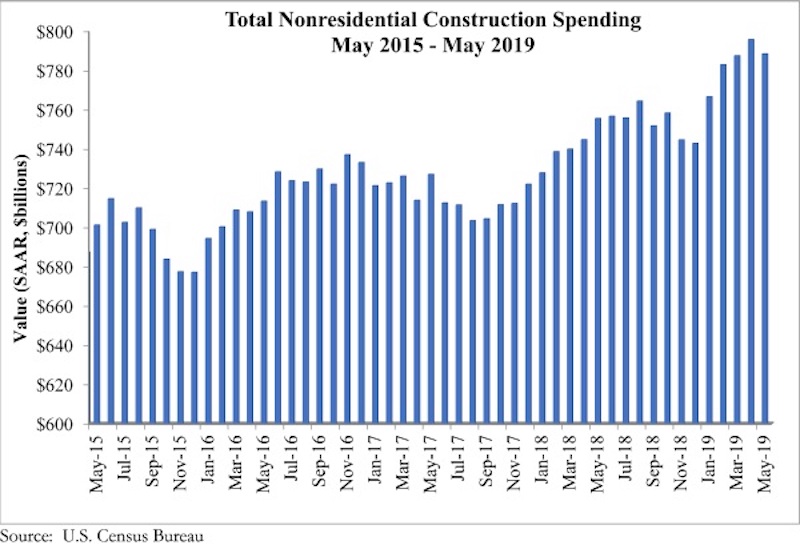
According to an Associated Builders and Contractors analysis of U.S. Census Bureau data published today, national nonresidential construction spending declined 0.9% in May, totaling $788.5 billion on a seasonally adjusted annualized basis and a 4.4% increase compared to the same time last year. While total public and private nonresidential spending declined 0.9% since April, public spending was up 11.2% and private spending was down 0.1% year over year.
Among the 16 nonresidential construction spending categories tracked by the Census Bureau, five experienced increases in monthly spending, including transportation (4%), communication (1.3%) and public safety (1.2%). Religious (-5.5%), commercial (-3.3%) and highway and street (-3.4%) experienced the largest monthly decreases, although highway and street spending remained up 17.1% compared to May 2018. Total construction spending is down 2.3% compared to the same time last year, and residential spending is down sharply.
“Private construction spending has been slipping for several months,” said ABC Chief Economist Anirban Basu. “Commercial construction spending decreased nearly 14% during the past year, which represents a stark reversal from previous trends when America’s consumer-spending-led expansion produced substantial demand for commercial construction. That said, commercial spending is up 102% compared to May 2010. Other private construction categories such as office and lodging have also been weak as rising construction and capital costs render pro formas more problematic. There are also growing concerns regarding overbuilding in certain segments/markets.
“What was different about today’s release was the decline in public construction spending,” said Basu. “While the drop was reasonably small on a monthly basis, it stands in stark contrast to the preexisting trend. With the economic expansion entering its record 11th year, state and local government finances are generally in good shape, leaving more money to spend on infrastructure. Based on broad economic dynamics and fiscal considerations, there is little reason to believe that the dip in May portends a slowdown in infrastructure spending during the months ahead.”
Related Stories

Hotel Facilities | Aug 2, 2023
Top 5 markets for hotel construction
According to the United States Construction Pipeline Trend Report by Lodging Econometrics (LE) for Q2 2023, the five markets with the largest hotel construction pipelines are Dallas with a record-high 184 projects/21,501 rooms, Atlanta with 141 projects/17,993 rooms, Phoenix with 119 projects/16,107 rooms, Nashville with 116 projects/15,346 rooms, and Los Angeles with 112 projects/17,797 rooms.

Market Data | Aug 1, 2023
Nonresidential construction spending increases slightly in June
National nonresidential construction spending increased 0.1% in June, according to an Associated Builders and Contractors analysis of data published today by the U.S. Census Bureau. Spending is up 18% over the past 12 months. On a seasonally adjusted annualized basis, nonresidential spending totaled $1.07 trillion in June.

Hotel Facilities | Jul 27, 2023
U.S. hotel construction pipeline remains steady with 5,572 projects in the works
The hotel construction pipeline grew incrementally in Q2 2023 as developers and franchise companies push through short-term challenges while envisioning long-term prospects, according to Lodging Econometrics.

Hotel Facilities | Jul 26, 2023
Hospitality building construction costs for 2023
Data from Gordian breaks down the average cost per square foot for 15-story hotels, restaurants, fast food restaurants, and movie theaters across 10 U.S. cities: Boston, Chicago, Las Vegas, Los Angeles, Miami, New Orleans, New York, Phoenix, Seattle, and Washington, D.C.

Market Data | Jul 24, 2023
Leading economists call for 2% increase in building construction spending in 2024
Following a 19.7% surge in spending for commercial, institutional, and industrial buildings in 2023, leading construction industry economists expect spending growth to come back to earth in 2024, according to the July 2023 AIA Consensus Construction Forecast Panel.

Contractors | Jul 13, 2023
Construction input prices remain unchanged in June, inflation slowing
Construction input prices remained unchanged in June compared to the previous month, according to an Associated Builders and Contractors analysis of U.S. Bureau of Labor Statistics Producer Price Index data released today. Nonresidential construction input prices were also unchanged for the month.

Contractors | Jul 11, 2023
The average U.S. contractor has 8.9 months worth of construction work in the pipeline, as of June 2023
Associated Builders and Contractors reported that its Construction Backlog Indicator remained unchanged at 8.9 months in June 2023, according to an ABC member survey conducted June 20 to July 5. The reading is unchanged from June 2022.

Market Data | Jul 5, 2023
Nonresidential construction spending decreased in May, its first drop in nearly a year
National nonresidential construction spending decreased 0.2% in May, according to an Associated Builders and Contractors analysis of data published today by the U.S. Census Bureau. On a seasonally adjusted annualized basis, nonresidential spending totaled $1.06 trillion.

Apartments | Jun 27, 2023
Average U.S. apartment rent reached all-time high in May, at $1,716
Multifamily rents continued to increase through the first half of 2023, despite challenges for the sector and continuing economic uncertainty. But job growth has remained robust and new households keep forming, creating apartment demand and ongoing rent growth. The average U.S. apartment rent reached an all-time high of $1,716 in May.

Industry Research | Jun 15, 2023
Exurbs and emerging suburbs having fastest population growth, says Cushman & Wakefield
Recently released county and metro-level population growth data by the U.S. Census Bureau shows that the fastest growing areas are found in exurbs and emerging suburbs.


