flexiblefullpage
billboard
interstitial1
catfish1
Currently Reading

Nonresidential construction spending falters in November

Market Data

Nonresidential construction spending falters in November

Only 4 of 16 subsectors showed gains


By John Caulfield, Senior Editor | January 5, 2016

The latter months of 2015 showed signs that construction spending's momentum had leveled off. Courtesy of Pixabay

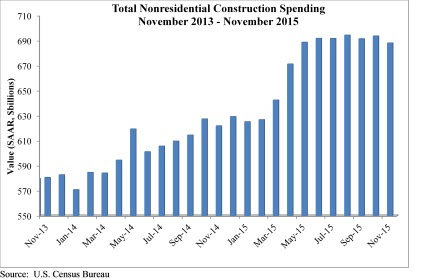
Spending for nonresidential construction, which had been on the uptick for most of 2015, stumbled in the latter months. 

The Census Bureau revised downward its spending estimates for September and October, and reported that spending in November stood at a seasonally adjusted annualized rate of $688.1 billion, down 0.8% from the lower October figure. 
 
Even though it was still up from November 2014's annualized rate of around $625 billion, November 2015 was the industry's worst-performing month since April 2015. 
 
Anirban Basu, chief economist for Associated Builders and Contractors (ABC), called Census's latest data “ominous,” because it showed that spending momentum “has softened considerably in recent months.” He added that ABC's surveys of construction executives paint a more dire picture of the industry's state.


“The most recent data suggest that while 2016 may be a year of nonresidential construction spending growth, it may not provide the degree of momentum that characterized much of 2015,” Basu said. He pointed specifically to construction related to the manufacturing sector, which in November was off 28.8% from November 2014. He believes this downturn reflects falling exports and stiffer competition from foreign producers.
 
ABC's analysis of Census's data found that only four of 16 construction subsectors showed positive gains in November: Communication, which was up 4.4% over October and 27.8% over November 2014; Education (up 3.9% and 13.8%), Office (1.6% and 20.5%), and Transportation (0.2% and 3.1%).
 
Conversely, spending for Public Safety projects fell 8.1% on a monthly basis, and 5.2% year over year. Even Healthcare, which had been the industry's shining light recently (it was up 5% from November 2014), slipped by 0.1% from October 2015.

Related Stories

Industry Research | Jun 22, 2017

ABC's Construction Backlog Indicator rebounds in 2017

The first quarter showed gains in all categories.

Market Data | Jun 21, 2017

Design billings maintain solid footing, strong momentum reflected in project inquiries/design contracts

Balanced growth results in billings gains in all sectors. 

Market Data | Jun 16, 2017

Residential construction was strong, but not enough, in 2016

The Joint Center for Housing Studies’ latest report expects minorities and millennials to account for the lion’s share of household formations through 2035.

Industry Research | Jun 15, 2017

Commercial Construction Index indicates high revenue and employment expectations for 2017

USG Corporation (USG) and U.S. Chamber of Commerce release survey results gauging confidence among industry leaders.

Market Data | Jun 2, 2017

Nonresidential construction spending falls in 13 of 16 segments in April

Nonresidential construction spending fell 1.7% in April 2017, totaling $696.3 billion on a seasonally adjusted, annualized basis, according to analysis of U.S. Census Bureau data released today by Associated Builders and Contractors.

Industry Research | May 25, 2017

Project labor agreement mandates inflate cost of construction 13%

Ohio schools built under government-mandated project labor agreements (PLAs) cost 13.12 percent more than schools that were bid and constructed through fair and open competition.

Market Data | May 24, 2017

Design billings increasing entering height of construction season

All regions report positive business conditions.

Market Data | May 24, 2017

The top franchise companies in the construction pipeline

3 franchise companies comprise 65% of all rooms in the Total Pipeline.

Industry Research | May 24, 2017

These buildings paid the highest property taxes in 2016

Office buildings dominate the list, but a residential community climbed as high as number two on the list.

Market Data | May 16, 2017

Construction firms add 5,000 jobs in April

Unemployment down to 4.4%; Specialty trade jobs dip slightly.

boombox1
boombox2
native1

More In Category

Construction Costs

New download: BD+C's May 2024 Market Intelligence Report

Building Design+Construction's monthly Market Intelligence Report offers a snapshot of the health of the U.S. building construction industry, including the commercial, multifamily, institutional, and industrial building sectors. This report tracks the latest metrics related to construction spending, demand for design services, contractor backlogs, and material price trends.


halfpage1

Most Popular Content

  1. 2021 Giants 400 Report
  2. Top 150 Architecture Firms for 2019
  3. 13 projects that represent the future of affordable housing
  4. Sagrada Familia completion date pushed back due to coronavirus
  5. Top 160 Architecture Firms 2021