

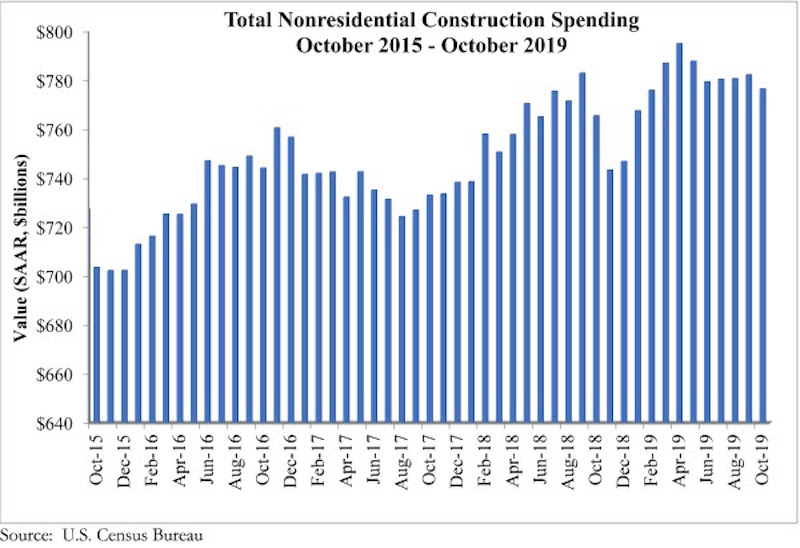
National nonresidential construction spending fell 0.7% in October but is up 1.4% compared to the same time last year, according to an Associated Builders and Contractors analysis of data published today by the U.S. Census Bureau. On a seasonally adjusted annualized basis, spending totaled $776.5 billion, 2.3% lower than the cyclical peak attained in April 2019.
Private nonresidential spending fell 1.2% on a monthly basis and is down 4.3% from October 2018. Public nonresidential construction spending also declined on a monthly basis, falling 0.1%. On an annual basis, however, public nonresidential spending is up 10.4%.
“At this point, economic indicators are providing mixed signals about the U.S. construction industry’s trajectory,” said ABC Chief Economist Anirban Basu. “Today’s release suggests that the industry’s spending cycle is winding toward a close and has been for about six months. Yet, according to the October employment data or ABC’s Construction Backlog Indicator, the story is very different. Those data tell the tale of an industry still wrestling with enormous levels of work and ongoing labor shortages.
“Moreover, though overall nonresidential construction spending is a bit lower than it was six months ago, there are still segments that are performing well,” said Basu. “A number of public construction segments experienced solid growth on monthly and annual bases, including public safety, conservation/development (e.g. flood control), educational and water supply. With state and local government budgets still generally healthy, spending on public works will conceivably remain elevated for the foreseeable future.
“The primary source of weakness has been private construction,” said Basu. “This is consistent with recent readings of ABC’s Construction Confidence Index and a number of other leading indicators. Among the segments softening the fastest are the manufacturing and commercial segments, which are both down on monthly and year-ago bases. Commercial construction is down more than 16% over the past year, which coincides with the fact that 2019 will set a record for store closings in the U.S. as e-commerce continues to gobble up market share. Lodging and office-related construction has also slowed of late, likely because developers have already exhausted many of the best investment opportunities.”


Related Stories

Market Data | Jan 31, 2022
Canada's hotel construction pipeline ends 2021 with 262 projects and 35,325 rooms
At the close of 2021, projects under construction stand at 62 projects/8,100 rooms.

Market Data | Jan 27, 2022
Record high counts for franchise companies in the early planning stage at the end of Q4'21
Through year-end 2021, Marriott, Hilton, and IHG branded hotels represented 585 new hotel openings with 73,415 rooms.

Market Data | Jan 27, 2022
Dallas leads as the top market by project count in the U.S. hotel construction pipeline at year-end 2021
The market with the greatest number of projects already in the ground, at the end of the fourth quarter, is New York with 90 projects/14,513 rooms.

Market Data | Jan 26, 2022
2022 construction forecast: Healthcare, retail, industrial sectors to lead ‘healthy rebound’ for nonresidential construction
A panel of construction industry economists forecasts 5.4 percent growth for the nonresidential building sector in 2022, and a 6.1 percent bump in 2023.

Market Data | Jan 24, 2022
U.S. hotel construction pipeline stands at 4,814 projects/581,953 rooms at year-end 2021
Projects scheduled to start construction in the next 12 months stand at 1,821 projects/210,890 rooms at the end of the fourth quarter.

Market Data | Jan 19, 2022
Architecture firms end 2021 on a strong note
December’s Architectural Billings Index (ABI) score of 52.0 was an increase from 51.0 in November.

Market Data | Jan 13, 2022
Materials prices soar 20% in 2021 despite moderating in December
Most contractors in association survey list costs as top concern in 2022.

Market Data | Jan 12, 2022
Construction firms forsee growing demand for most types of projects
Seventy-four percent of firms plan to hire in 2022 despite supply-chain and labor challenges.

Market Data | Jan 7, 2022
Construction adds 22,000 jobs in December
Jobless rate falls to 5% as ongoing nonresidential recovery offsets rare dip in residential total.

Market Data | Jan 6, 2022
Inflation tempers optimism about construction in North America
Rider Levett Bucknall’s latest report cites labor shortages and supply chain snags among causes for cost increases.


