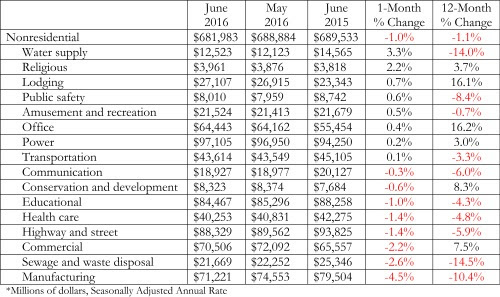
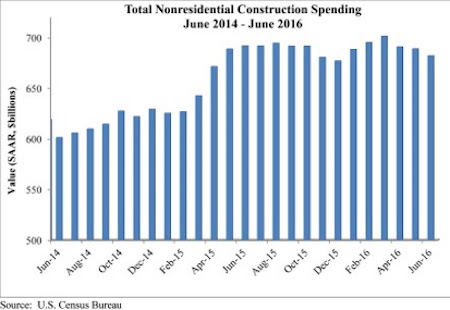
Nonresidential construction spending dipped 1 percent in June and has now contracted for three consecutive months according to analysis of U.S. Census Bureau data released today by Associated Builders and Contractors (ABC). Nonresidential spending, which totaled $682 billion on a seasonally adjusted, annualized rate, has fallen 1.1 percent on a year-over-year basis, marking the first time nonresidential spending has declined on an annual basis since July 2013.
“On a monthly basis, the numbers are not as bad as they seem, as May’s nonresidential construction spending estimate was revised higher. However, this fails to explain the first year-over-year decline in nearly three years,” says ABC Chief Economist Anirban Basu.
“Thanks in part to the investment of foreign capital in America, spending related to office space and lodging are up by more than 16 percent year-over-year,” says Basu. The global economy is weak, and international investors are searching for yield and stability. U.S. commercial real estate has become a popular destination for foreign capital. However, the weakness of the global economy may also help explain the decline in manufacturing-related construction spending of nearly 5 percent for the month and more than 10 percent year-over-year.
Consumer spending is the only significant driver of economic growth in America right now and public sector spending does not look like it will accelerate in the near future, despite a federal highway bill that was pasted last year, Basu explains.
Precisely half of the 16 nonresidential subsectors expanded in June. Two of the largest subsectors—manufacturing and commercial—experienced significant contractions in June, however, and were responsible for a majority of the dip in spending.
Tepid spending by public agencies also continues to shape the data. Despite a monthly pick-up in spending, water-supply construction spending is down 14 percent on a year-over-year basis. Public safety construction spending is down 8.4 percent from a year ago, sewage and waste disposal by nearly 15 percent, highway and street by about 6 percent, education by 4 percent and transportation by more than 3 percent.
Related Stories
Industry Research | Jun 26, 2017
Time to earn an architecture license continues to drop
This trend is driven by candidates completing the experience and examination programs concurrently and more quickly.
Industry Research | Jun 22, 2017
ABC's Construction Backlog Indicator rebounds in 2017
The first quarter showed gains in all categories.
Market Data | Jun 21, 2017
Design billings maintain solid footing, strong momentum reflected in project inquiries/design contracts
Balanced growth results in billings gains in all sectors.
Industry Research | Jun 15, 2017
Commercial Construction Index indicates high revenue and employment expectations for 2017
USG Corporation (USG) and U.S. Chamber of Commerce release survey results gauging confidence among industry leaders.
Industry Research | Jun 13, 2017
Gender, racial, and ethnic diversity increases among emerging professionals
For the first time since NCARB began collecting demographics data, gender equity improved along every career stage.
Industry Research | May 25, 2017
Project labor agreement mandates inflate cost of construction 13%
Ohio schools built under government-mandated project labor agreements (PLAs) cost 13.12 percent more than schools that were bid and constructed through fair and open competition.
Market Data | May 24, 2017
Design billings increasing entering height of construction season
All regions report positive business conditions.
Market Data | May 24, 2017
The top franchise companies in the construction pipeline
3 franchise companies comprise 65% of all rooms in the Total Pipeline.
Industry Research | May 24, 2017
These buildings paid the highest property taxes in 2016
Office buildings dominate the list, but a residential community climbed as high as number two on the list.
Market Data | May 16, 2017
Construction firms add 5,000 jobs in April
Unemployment down to 4.4%; Specialty trade jobs dip slightly.


