


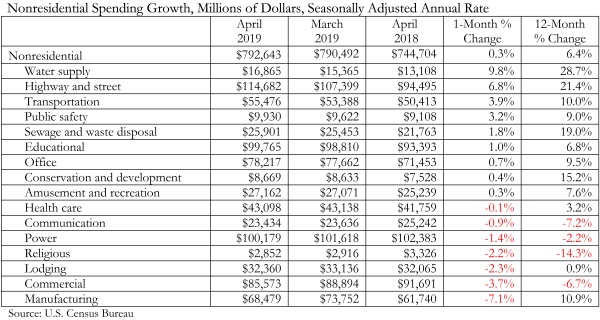
According to an Associated Builders and Contractors analysis of U.S. Census Bureau data released today, national nonresidential construction spending rose 0.3% in April, totaling $792.6 billion on a seasonally adjusted annualized basis, which is a 6.4% increase compared to the same time last year. While public nonresidential spending expanded 4.8% on a monthly basis and increased 15.4% since April 2018, private nonresidential spending fell 2.9% in April and is up just 0.6 % year-over-year.
Among the 16 nonresidential construction spending categories, nine experienced an increase in monthly spending, with the largest increases registered in water supply (9.8%), highway and street (6.8%) and transportation (3.9%). Manufacturing (-7.1%) and commercial (-3.7%) experienced the largest decreases in April, though manufacturing spending is still up 10.9% compared to the same time last year.
“Today’s data release shows that nonresidential construction spending remains vigorous in America,” said ABC Chief Economist Anirban Basu. “While April’s monthly nonresidential construction spending growth of 0.3 percent appears lackluster, this was largely the result of a sizeable upward revision to March construction spending figures.
“Today’s data release also indicates that the baton has now been fully passed,” said Basu. “Earlier in the recovery, nonresidential construction spending growth was primarily driven by private segments. Low interest rates and abundant liquidity helped fuel private investment in hotels, data centers, casinos, fulfillment centers and other forms of private construction. But over the past year, private nonresidential construction spending has barely budged. Meanwhile, public residential spending is up 15.4 percent and April’s spending growth was led by water supply and highway/street.
“Given current levels of backlog, which expanded to 9.5 months in March 2019, nonresidential construction spending should remain elevated,” said Basu. “That said, risks of recession in 2020 are rapidly rising, which has the potential to reduce construction activity in 2021 and/or 2022.”
Related Stories

Industry Research | Jun 26, 2017
Time to earn an architecture license continues to drop
This trend is driven by candidates completing the experience and examination programs concurrently and more quickly.

Industry Research | Jun 22, 2017
ABC's Construction Backlog Indicator rebounds in 2017
The first quarter showed gains in all categories.

Market Data | Jun 21, 2017
Design billings maintain solid footing, strong momentum reflected in project inquiries/design contracts
Balanced growth results in billings gains in all sectors.

Market Data | Jun 16, 2017
Residential construction was strong, but not enough, in 2016
The Joint Center for Housing Studies’ latest report expects minorities and millennials to account for the lion’s share of household formations through 2035.

Industry Research | Jun 15, 2017
Commercial Construction Index indicates high revenue and employment expectations for 2017
USG Corporation (USG) and U.S. Chamber of Commerce release survey results gauging confidence among industry leaders.

Market Data | Jun 2, 2017
Nonresidential construction spending falls in 13 of 16 segments in April
Nonresidential construction spending fell 1.7% in April 2017, totaling $696.3 billion on a seasonally adjusted, annualized basis, according to analysis of U.S. Census Bureau data released today by Associated Builders and Contractors.

Industry Research | May 25, 2017
Project labor agreement mandates inflate cost of construction 13%
Ohio schools built under government-mandated project labor agreements (PLAs) cost 13.12 percent more than schools that were bid and constructed through fair and open competition.

Market Data | May 24, 2017
Design billings increasing entering height of construction season
All regions report positive business conditions.

Market Data | May 24, 2017
The top franchise companies in the construction pipeline
3 franchise companies comprise 65% of all rooms in the Total Pipeline.

Industry Research | May 24, 2017
These buildings paid the highest property taxes in 2016
Office buildings dominate the list, but a residential community climbed as high as number two on the list.


