


According to the common measure of housing affordability, a household is considered "cost-burdened" when housing expenses consume over 30% of occupant's total gross income. Those that spend more than 50% of their income on monthly housing costs are classified as "severely" cost-burdened.
The most recent data derived from the 2022 Census American Community Survey reveals that the proportion of American renters facing housing cost burdens has reached its highest point since 2012, undoing the progress made in the ten years leading up to the pandemic. The majority of this increase can be attributed to a surge in severely burdened households—those expending more than half of their earnings on rent.
The latest report by Apartment List explores the cost burden rate and what it says about the state of housing affordability in the U.S. Here are some of their takeaways:
1. The pandemic burdened nearly 2 million renters in the last three years
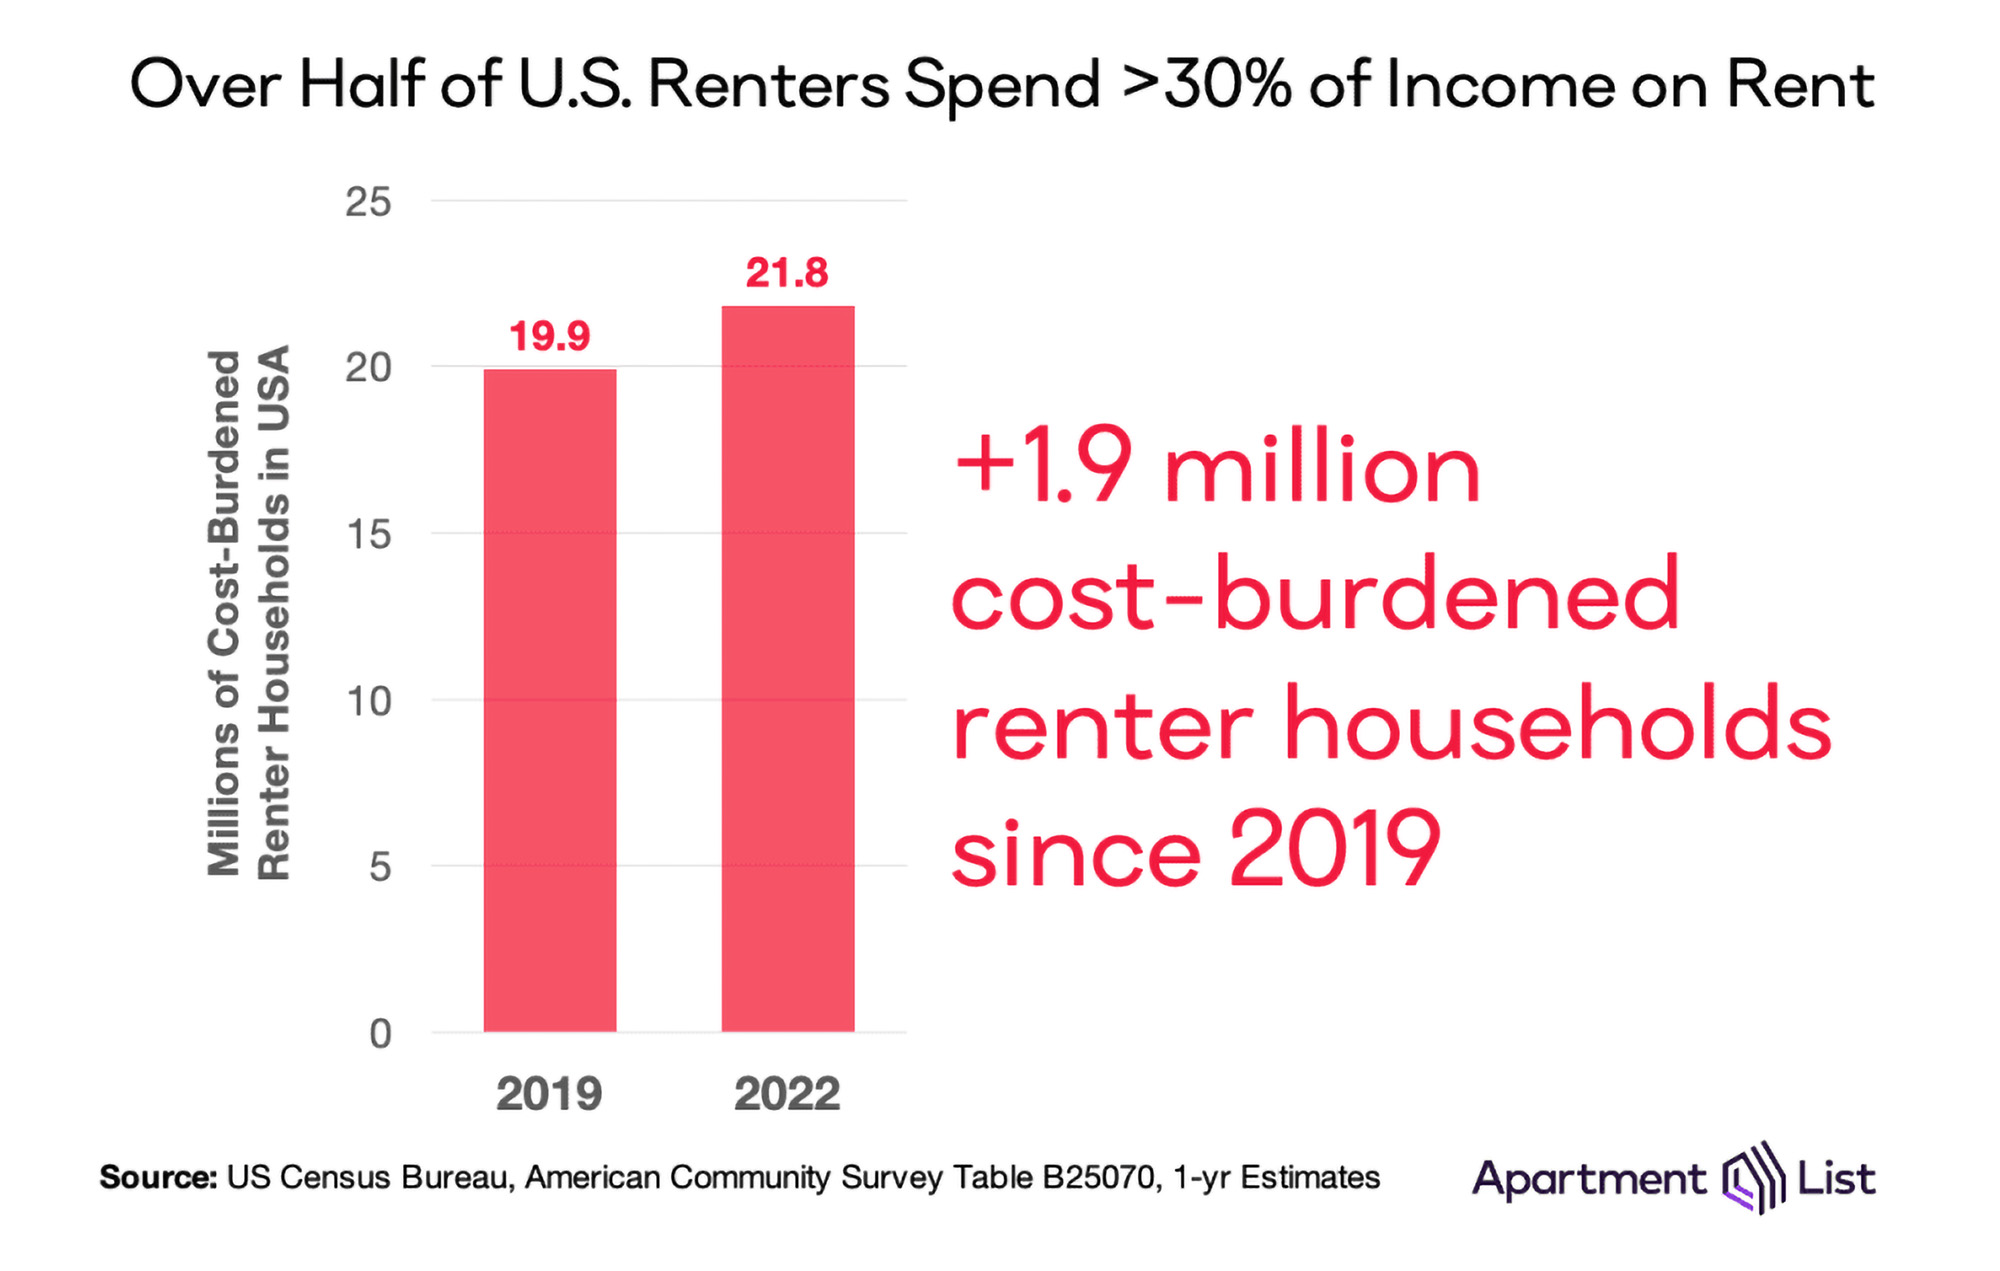
The number of cost-burdened renter households have been decreasing steadily since 2011. In a five-year span alone, the number of homes fell by 826,000 between 2014 and 2019. By 2019, just under 20 million renter households were considered cost-burdened.
In 2022, however, the number of cost-burdened renter households has increased by 1.9 million—making the total 21.8 million—and the number of non-burdened households fell by 957,000.
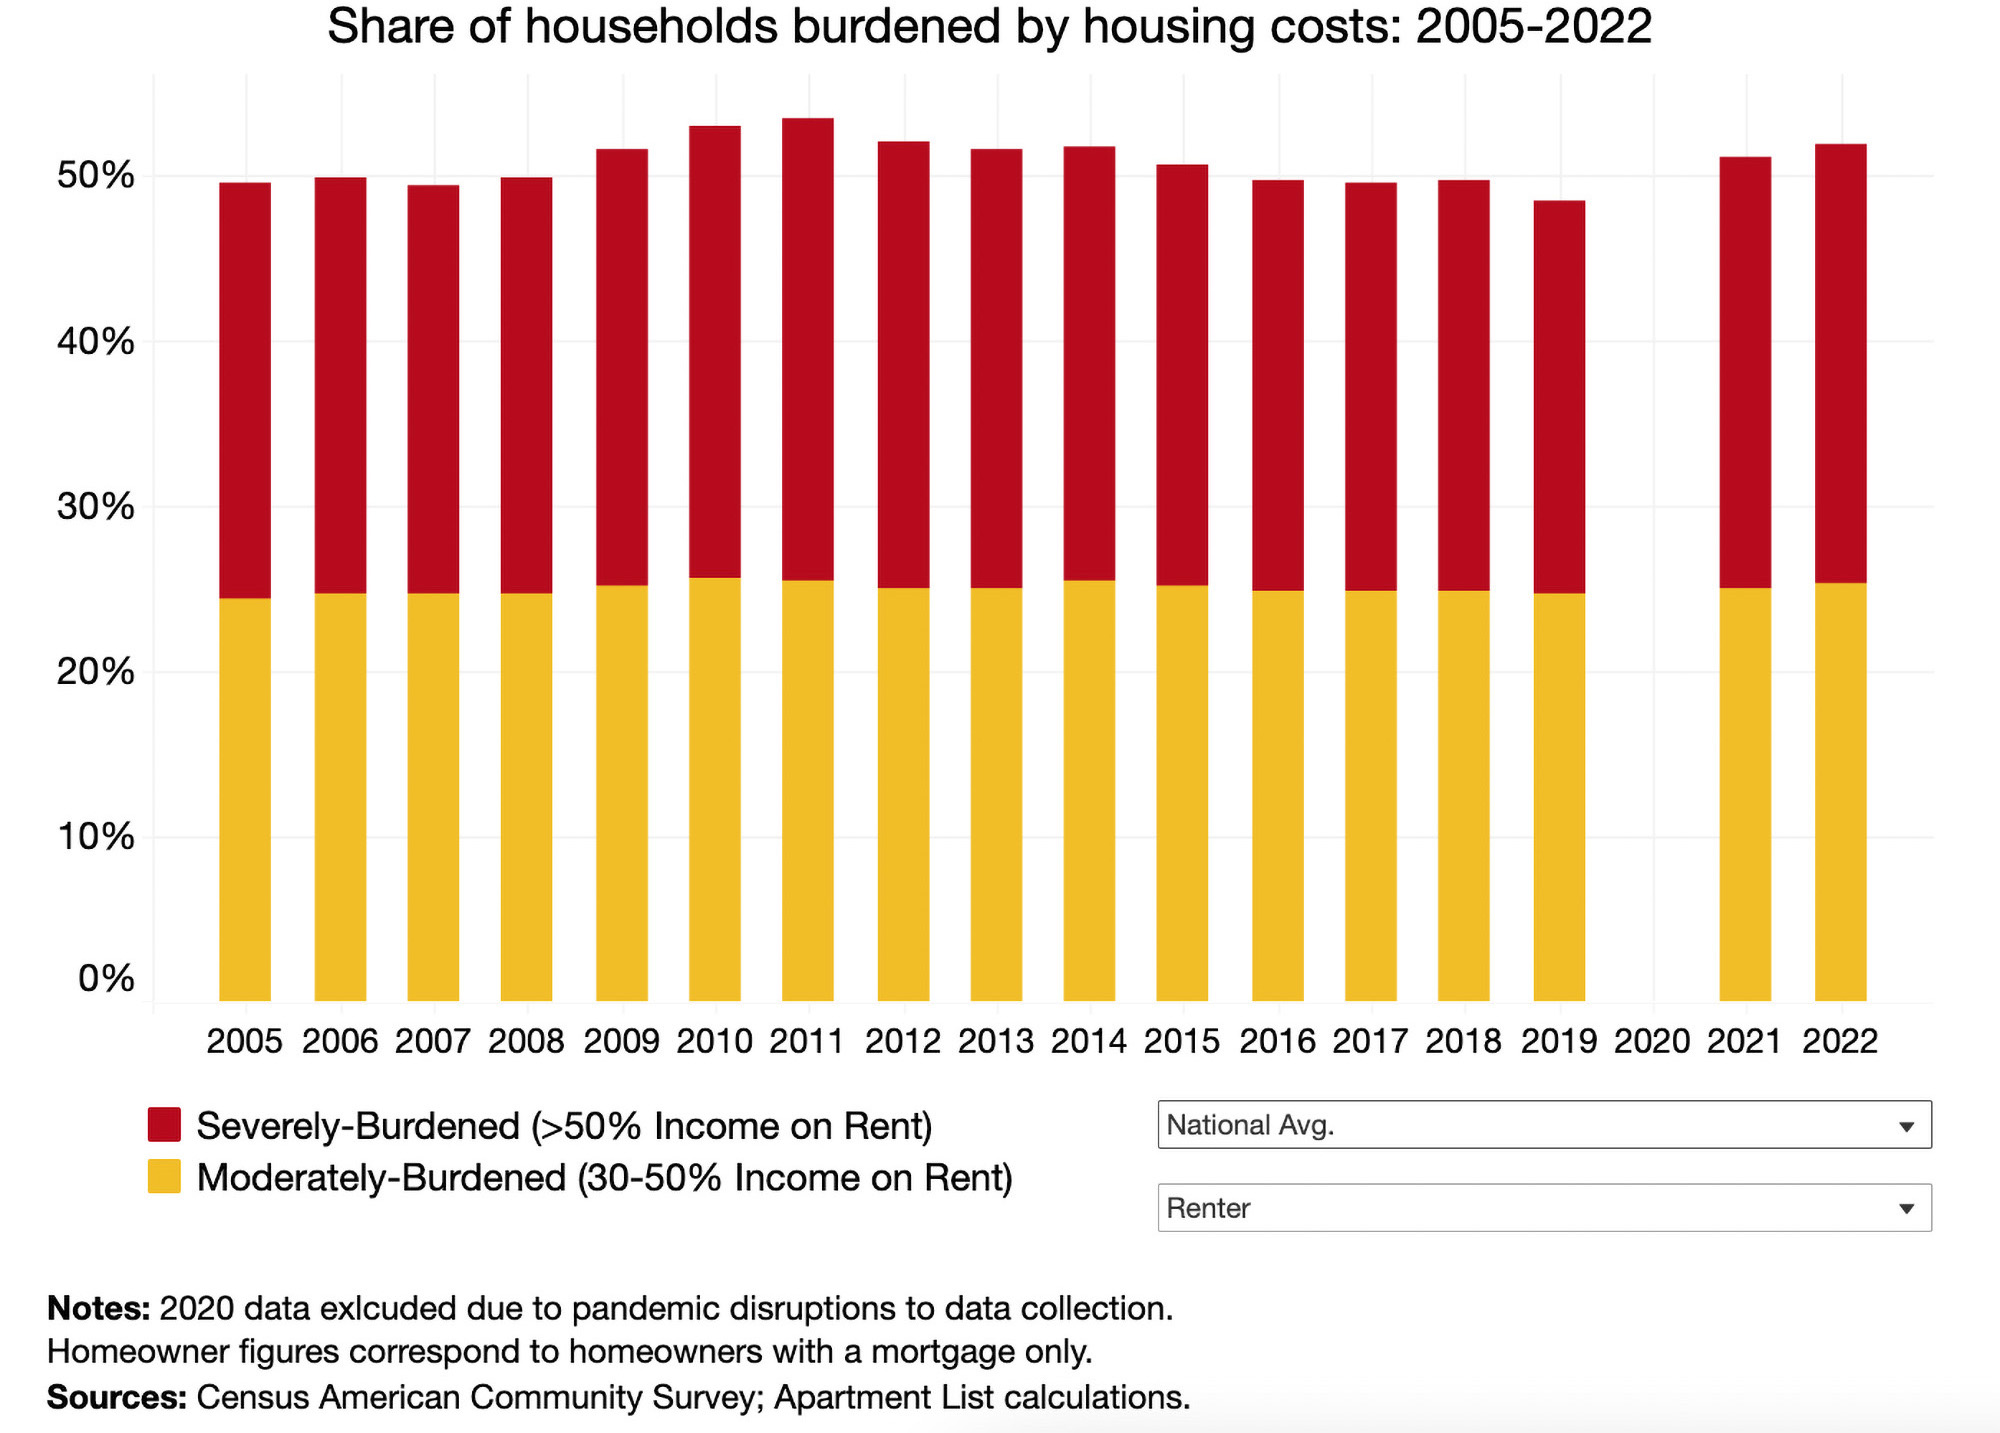
2. Severely-burdened households make up 27% of those affected
Renter households that spend more that 50% of their income on housing costs are considered severely-burdened. In the past three years, the share of these households among the total of those burdened increased by 3% to 26.7 percent.
Though the cost burden rate is much lower for those who own homes, it has also been rising in recent years. In 2022, the percentage of homeowners that are cost-burdened jumped to 27.9 percent, up from 26.6% in 2019.
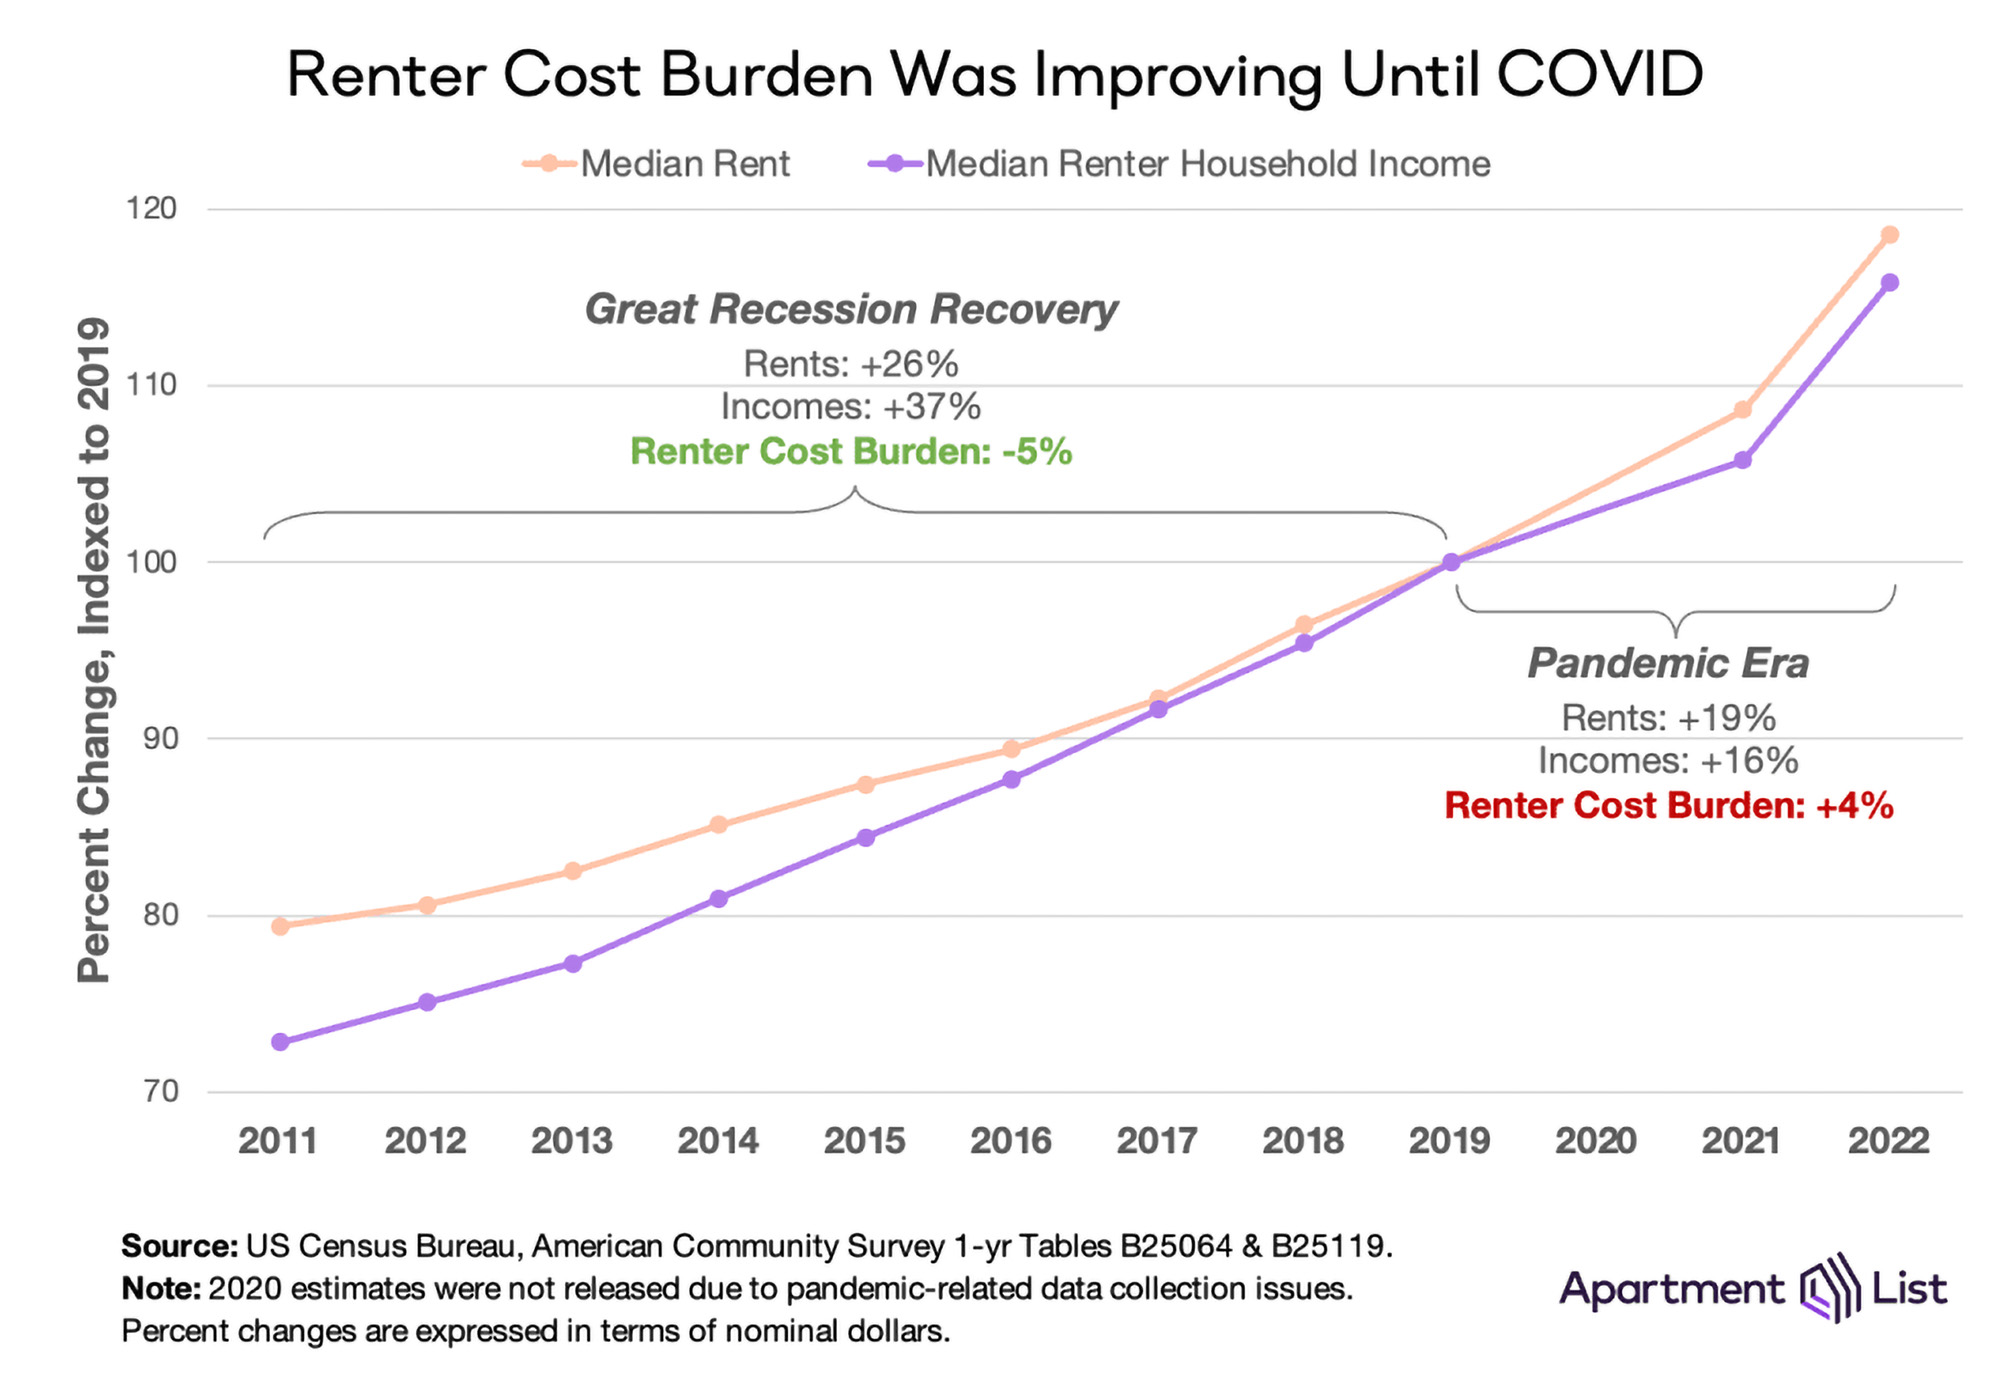
3. The cost burden is driven by rent prices rising faster than household incomes
After the Great Recession, renter cost burden improved gradually for several years. While the median rent rose 26 percent, the median renter household income increased 37 percent in the same eight years.
Since 2019, renter cost burden has increased 4% and median rent jumped up 19 percent, while renter income rose only 16 percent. According to the Apartment List analysis, 74 of the 100 largest U.S. metros have experienced rent prices growing faster than renter income. Since 2019, the cost burden has worsened in nearly all (94%) of the top metros.
Future outlook from Apartment List
"Preliminary data from the Bureau of Labor Statistics shows that incomes in the second quarter of 2023 are up 5.7% year-over-year (1.7% after adjusting for inflation). And while these statistics are not available for renters specifically, other breakdowns show that recent wage growth is higher for lower-earners and non-white workers, who are both more likely to rent.
However, rent growth may also continue on an upward trajectory. For more than half of all renter households, monthly rent payments are eating up a large enough share of their income to put financial stability at risk. And more than one-in-four renter households spend more than half of their income on rent—a level which can often necessitate extreme measures such as overcrowding and cutting back on spending on other basic needs. Thankfully, policymakers have demonstrated an increased focus on this issue in recent years, but solutions are still urgently needed."
To read the full report, visit Apartment List
Related Stories

Market Data | Jun 14, 2016
Transwestern: Market fundamentals and global stimulus driving economic growth
A new report from commercial real estate firm Transwestern indicates steady progress for the U.S. economy. Consistent job gains, wage growth, and consumer spending have offset declining corporate profits, and global stimulus plans appear to be effective.
Market Data | Jun 7, 2016
Global construction disputes took longer to resolve in 2015
The good news: the length and value of disputes in the U.S. fell last year, according to latest Arcadis report.

Market Data | Jun 3, 2016
JLL report: Retail renovation drives construction growth in 2016
Retail construction projects were up nearly 25% year-over-year, and the industrial and office construction sectors fared well, too. Economic uncertainty looms over everything, however.

Market Data | Jun 2, 2016
ABC: Nonresidential construction spending down in April
Lower building material prices, a sluggish U.S. economy, and hesitation among private developers all factor into the 2.1% drop.

Market Data | May 20, 2016
Report: Urban area population growth slows
Older Millennials are looking to buy homes and move away to more affordable suburbs and exurbs.
Market Data | May 17, 2016
Modest growth for AIA’s Architecture Billings Index in April
The American Institute of Architects reported the April ABI score was 50.6, down from the mark of 51.9 in the previous month. This score still reflects an increase in design services.

Market Data | Apr 29, 2016
ABC: Quarterly GDP growth slowest in two years
Bureau of Economic Analysis data indicates that the U.S. output is barely growing and that nonresidential investment is down.

Market Data | Apr 20, 2016
AIA: Architecture Billings Index ends first quarter on upswing
The multi-family residential sector fared the best. The Midwest was the only U.S. region that didn't see an increase in billings.
Building Technology | Apr 11, 2016
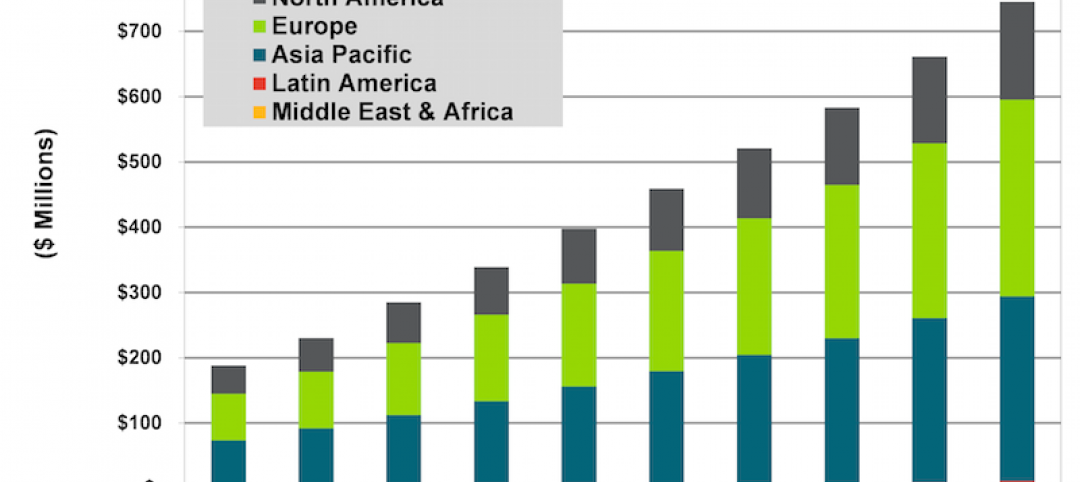
A nascent commercial wireless sensor market is poised to ascend in the next decade
Europe and Asia will propel that growth, according to a new report from Navigant.

Industry Research | Apr 7, 2016
CBRE provides latest insight into healthcare real estate investors’ strategies
Survey respondents are targeting smaller acquisitions, at a time when market cap rates are narrowing for different product types.


