


According to the common measure of housing affordability, a household is considered "cost-burdened" when housing expenses consume over 30% of occupant's total gross income. Those that spend more than 50% of their income on monthly housing costs are classified as "severely" cost-burdened.
The most recent data derived from the 2022 Census American Community Survey reveals that the proportion of American renters facing housing cost burdens has reached its highest point since 2012, undoing the progress made in the ten years leading up to the pandemic. The majority of this increase can be attributed to a surge in severely burdened households—those expending more than half of their earnings on rent.
The latest report by Apartment List explores the cost burden rate and what it says about the state of housing affordability in the U.S. Here are some of their takeaways:
1. The pandemic burdened nearly 2 million renters in the last three years
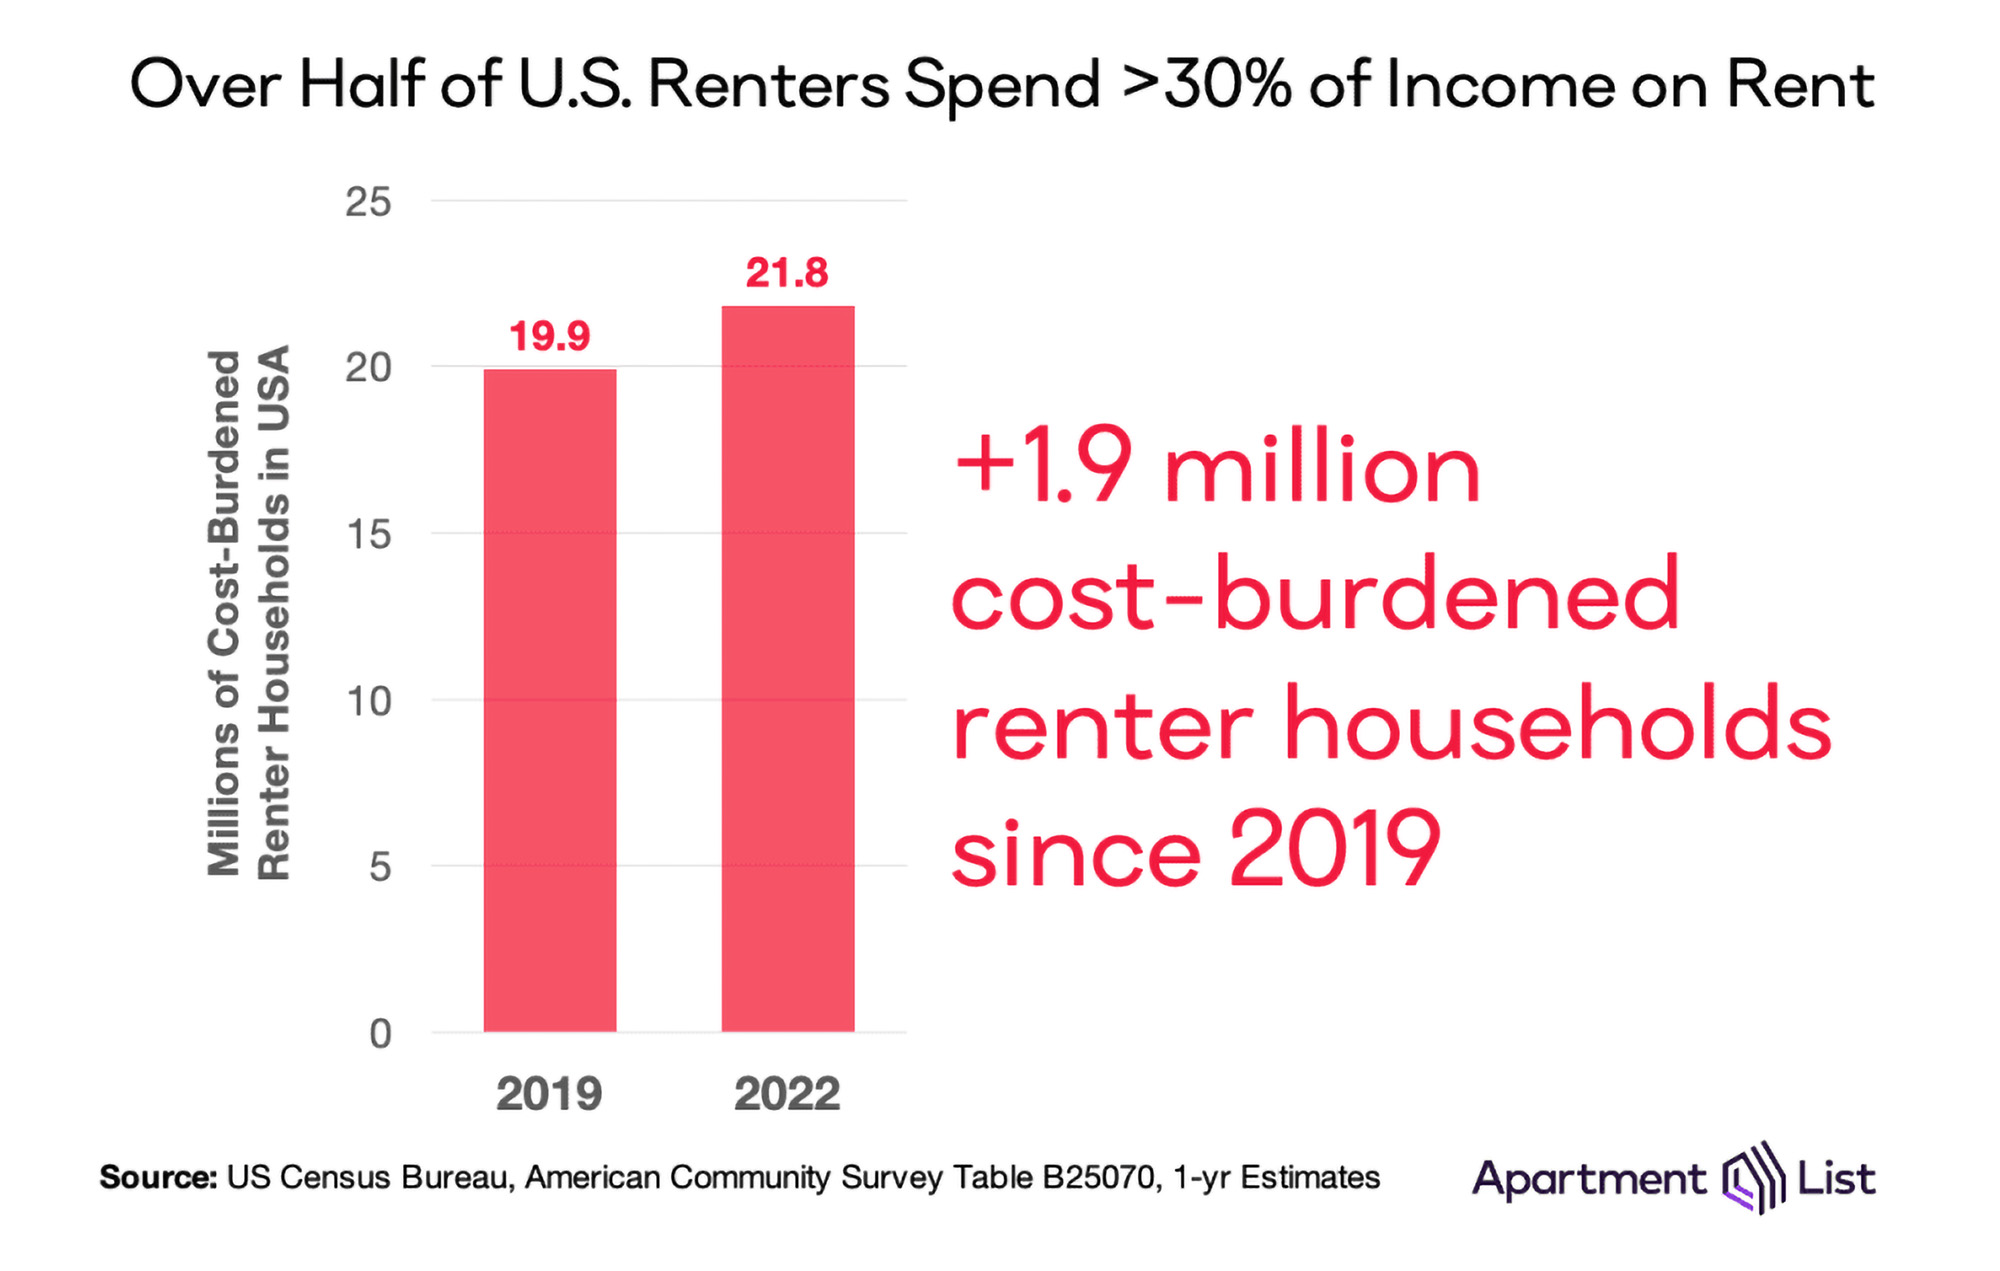
The number of cost-burdened renter households have been decreasing steadily since 2011. In a five-year span alone, the number of homes fell by 826,000 between 2014 and 2019. By 2019, just under 20 million renter households were considered cost-burdened.
In 2022, however, the number of cost-burdened renter households has increased by 1.9 million—making the total 21.8 million—and the number of non-burdened households fell by 957,000.
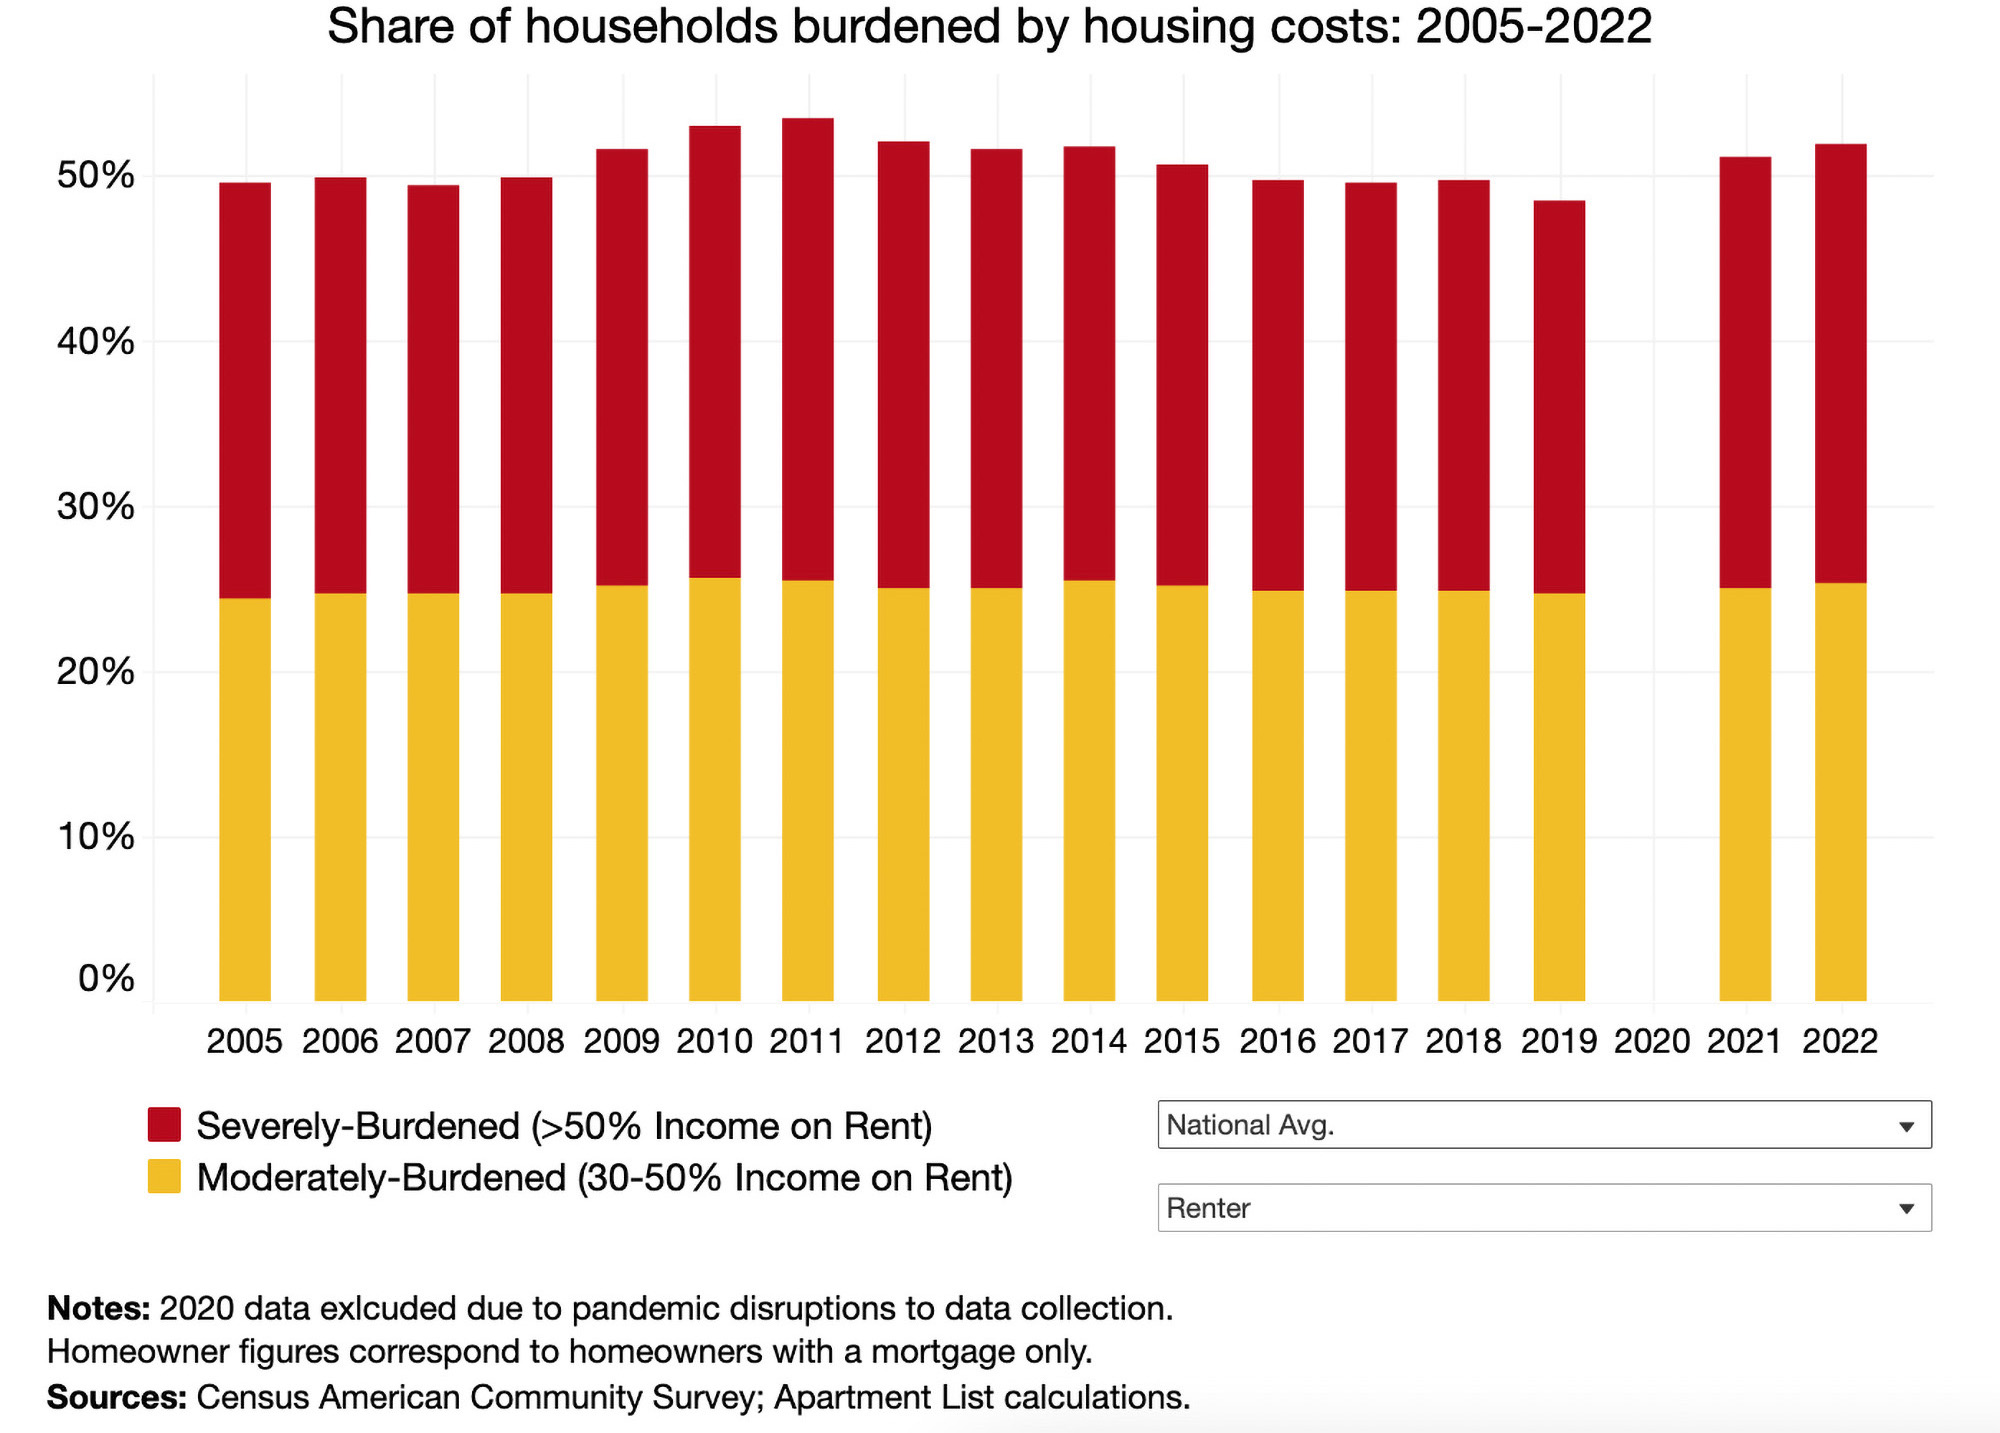
2. Severely-burdened households make up 27% of those affected
Renter households that spend more that 50% of their income on housing costs are considered severely-burdened. In the past three years, the share of these households among the total of those burdened increased by 3% to 26.7 percent.
Though the cost burden rate is much lower for those who own homes, it has also been rising in recent years. In 2022, the percentage of homeowners that are cost-burdened jumped to 27.9 percent, up from 26.6% in 2019.
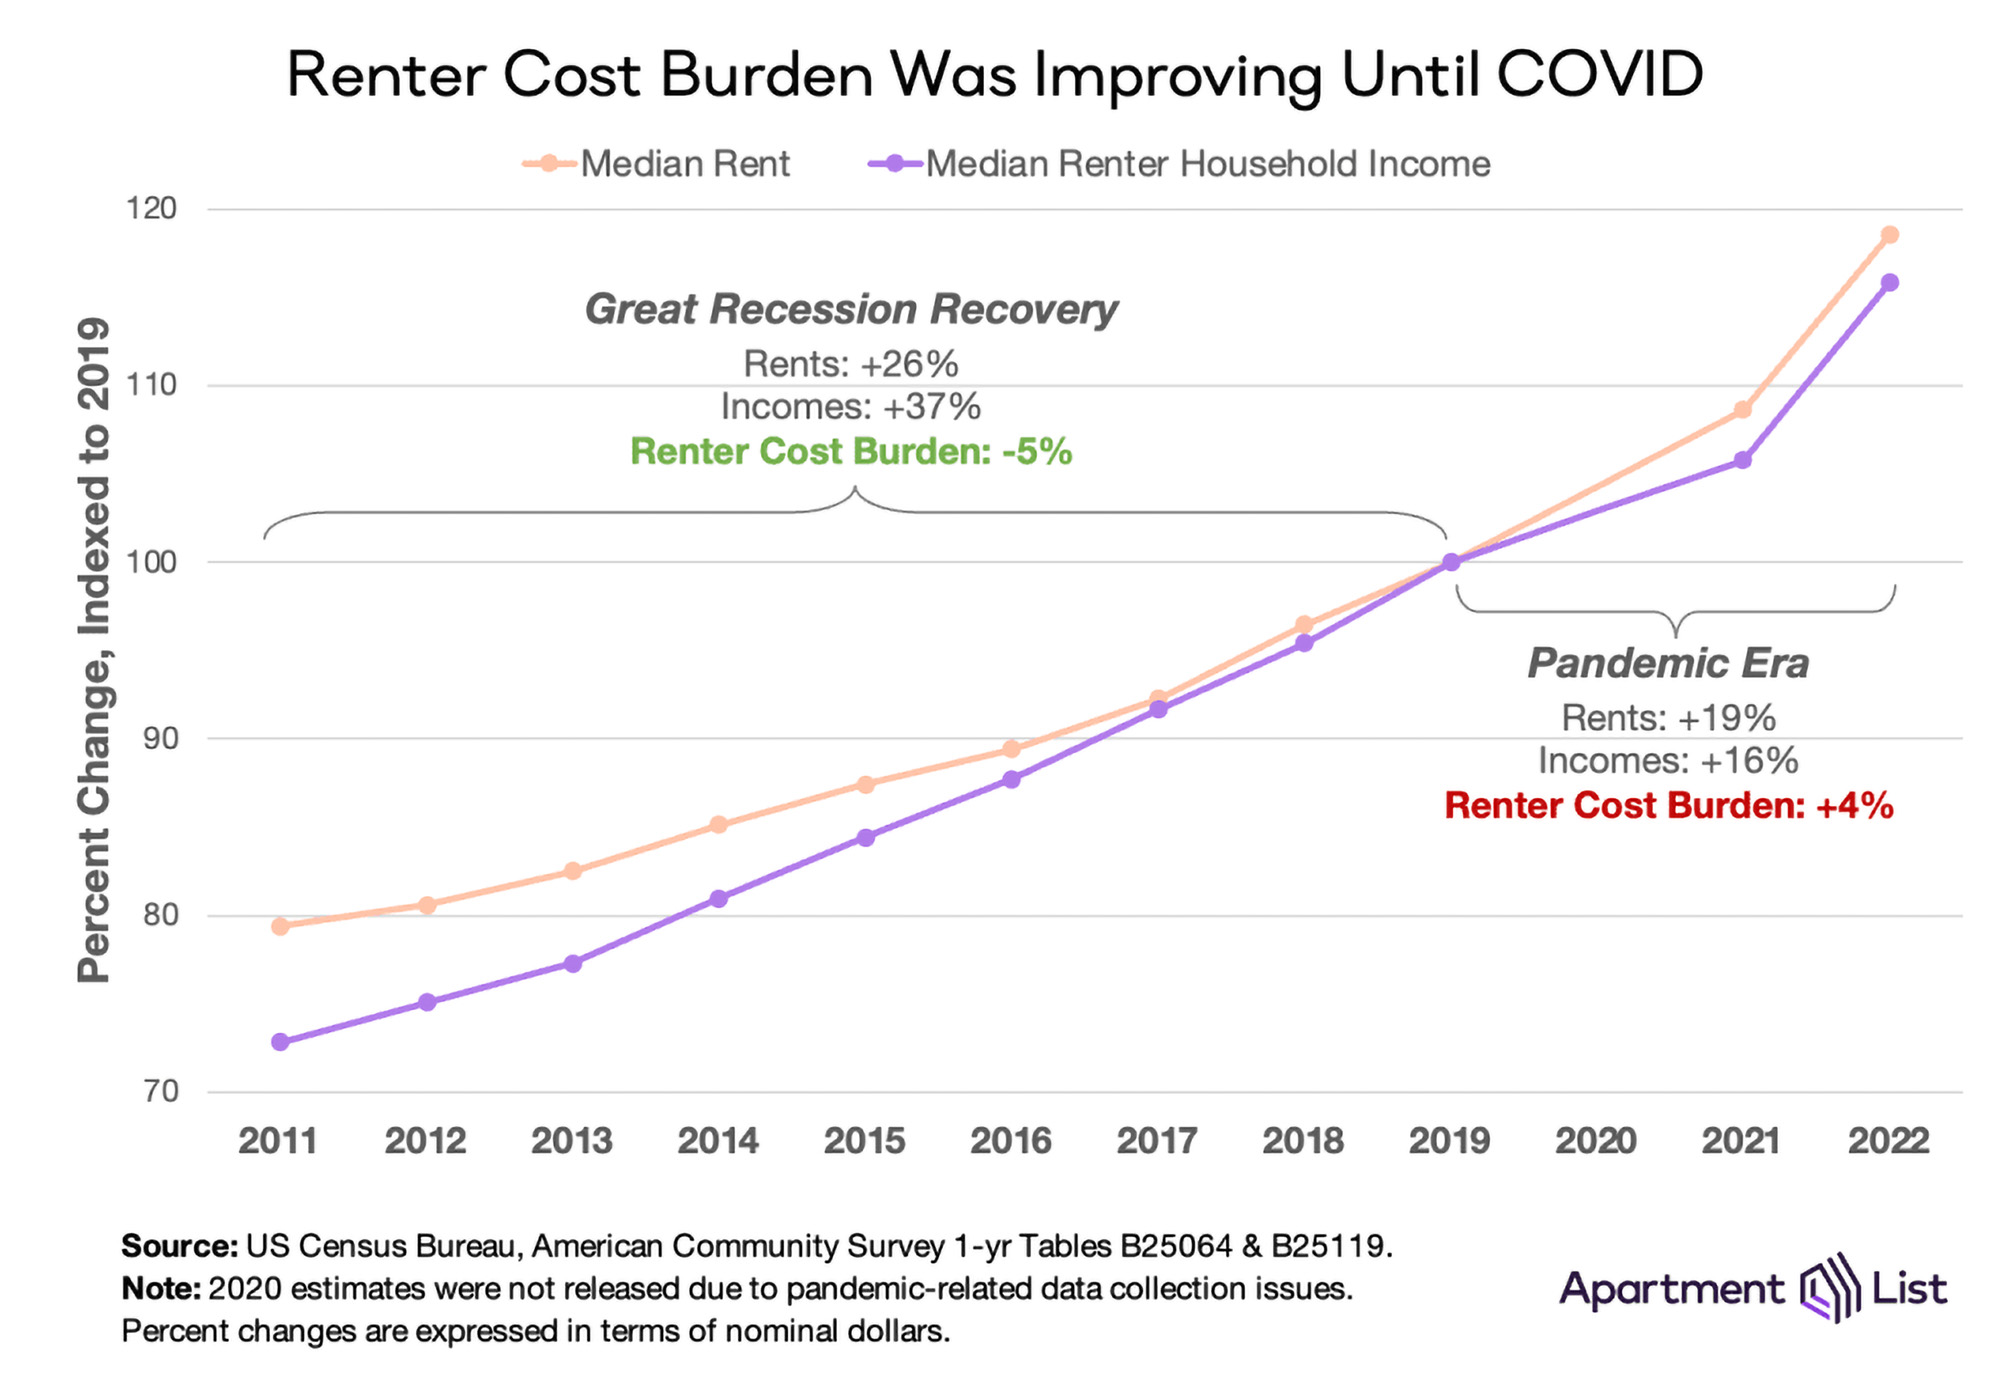
3. The cost burden is driven by rent prices rising faster than household incomes
After the Great Recession, renter cost burden improved gradually for several years. While the median rent rose 26 percent, the median renter household income increased 37 percent in the same eight years.
Since 2019, renter cost burden has increased 4% and median rent jumped up 19 percent, while renter income rose only 16 percent. According to the Apartment List analysis, 74 of the 100 largest U.S. metros have experienced rent prices growing faster than renter income. Since 2019, the cost burden has worsened in nearly all (94%) of the top metros.
Future outlook from Apartment List
"Preliminary data from the Bureau of Labor Statistics shows that incomes in the second quarter of 2023 are up 5.7% year-over-year (1.7% after adjusting for inflation). And while these statistics are not available for renters specifically, other breakdowns show that recent wage growth is higher for lower-earners and non-white workers, who are both more likely to rent.
However, rent growth may also continue on an upward trajectory. For more than half of all renter households, monthly rent payments are eating up a large enough share of their income to put financial stability at risk. And more than one-in-four renter households spend more than half of their income on rent—a level which can often necessitate extreme measures such as overcrowding and cutting back on spending on other basic needs. Thankfully, policymakers have demonstrated an increased focus on this issue in recent years, but solutions are still urgently needed."
To read the full report, visit Apartment List
Related Stories

Self-Storage Facilities | Dec 16, 2022
Self-storage development booms in high multifamily construction areas
A 2022 RentCafe analysis finds that self-storage units swelled in conjunction with metros’ growth in apartment complexes.

Market Data | Dec 13, 2022
Contractors' backlog of work reaches three-year high
U.S. construction firms have, on average, 9.2 months of work in the pipeline, according to ABC's latest Construction Backlog Indicator.

Contractors | Dec 6, 2022
Slow payments cost the construction industry $208 billion in 2022
The cost of floating payments for wages and invoices represents $208 billion in excess cost to the construction industry, a 53% increase from 2021, according to a survey by Rabbet, a provider of construction finance software.

Mass Timber | Dec 1, 2022
Cross laminated timber market forecast to more than triple by end of decade
Cross laminated timber (CLT) is gaining acceptance as an eco-friendly building material, a trend that will propel its growth through the end of the 2020s. The CLT market is projected to more than triple from $1.11 billion in 2021 to $3.72 billion by 2030, according to a report from Polaris Market Research.

Market Data | Nov 15, 2022
Construction demand will be a double-edged sword in 2023
Skanska’s latest forecast sees shorter lead times and receding inflation, but the industry isn’t out of the woods yet.

Reconstruction & Renovation | Nov 8, 2022
Renovation work outpaces new construction for first time in two decades
Renovations of older buildings in U.S. cities recently hit a record high as reflected in architecture firm billings, according to the American Institute of Architects (AIA).

Market Data | Nov 3, 2022
Building material prices have become the calm in America’s economic storm
Linesight’s latest quarterly report predicts stability (mostly) through the first half of 2023

Building Team | Nov 1, 2022
Nonresidential construction spending increases slightly in September, says ABC
National nonresidential construction spending was up by 0.5% in September, according to an Associated Builders and Contractors analysis of data published today by the U.S. Census Bureau.

Hotel Facilities | Oct 31, 2022
These three hoteliers make up two-thirds of all new hotel development in the U.S.
With a combined 3,523 projects and 400,490 rooms in the pipeline, Marriott, Hilton, and InterContinental dominate the U.S. hotel construction sector.

Codes and Standards | Oct 26, 2022
‘Landmark study’ offers key recommendations for design-build delivery
The ACEC Research Institute and the University of Colorado Boulder released what the White House called a “landmark study” on the design-build delivery method.


