

Top Local Government Sector Architecture Firms
| Rank | Company | 2012 Local Government Revenue ($) |
| 1 | Stantec | $71,896,892 |
| 2 | HOK | $49,140,000 |
| 3 | IBI Group | $37,523,493 |
| 4 | Heery International | $23,648,201 |
| 5 | PGAL | $19,500,000 |
| 6 | Perkins+Will | $12,997,959 |
| 7 | EYP | $11,000,000 |
| 8 | Skidmore, Owings & Merrill | $10,903,000 |
| 9 | Reynolds, Smith and Hills | $10,900,000 |
| 10 | ZGF Architects | $10,014,686 |
| 11 | Leo A Daly | $9,843,419 |
| 12 | HDR Architecture | $9,088,649 |
| 13 | Kaplan McLaughlin Diaz | $8,401,994 |
| 14 | Fentress Architects | $7,864,890 |
| 15 | SmithGroupJJR | $7,200,000 |
| 16 | HMC Architects | $6,473,080 |
| 17 | HNTB Archtecture | $5,733,633 |
| 18 | Sasaki Associates | $5,532,630 |
| 19 | Epstein | $5,089,000 |
| 20 | Wight & Co. | $4,710,300 |
| 21 | Moseley Architects | $4,431,529 |
| 22 | Albert Kahn Family of Companies | $4,411,177 |
| 23 | Beyer Blinder Belle Architects & Planners | $4,215,038 |
| 24 | LMN Architects | $4,125,500 |
| 25 | HKS | $3,600,000 |
| 26 | Goodwyn, Mills & Cawood | $3,560,000 |
| 27 | BBS Architects, Landscape Architects and Engineers | $3,100,000 |
| 28 | Swanke Hayden Connell Asrchitects | $3,000,000 |
| 29 | Ennead Architects | $2,890,000 |
| 30 | FGM Architects | $2,722,245 |
| 31 | Little | $2,529,000 |
| 32 | Morris Architects | $2,300,000 |
| 33 | Fletcher-Thompson | $2,275,000 |
| 34 | CTA Architects Engineers | $1,610,105 |
| 35 | LPA | $1,582,631 |
| 36 | Solomon Cordwell Buenz | $1,500,000 |
| 36 | Westlake Reed Leskosky | $1,500,000 |
| 38 | NBBJ | $1,439,000 |
| 39 | Harley Ellis Devereaux | $1,323,000 |
| 40 | RNL | $832,000 |
| 41 | Kirksey Architecture | $784,592 |
| 42 | CO Architects | $772,000 |
| 43 | Good Fulton & Farrell | $761,297 |
| 44 | TEG Architects - The Estopinal Group | $754,228 |
| 45 | H3 Hardy Collaboration Architecture | $750,000 |
| 46 | KZF Design | $736,905 |
| 47 | Nadel | $679,134 |
| 48 | Hoefer Wysocki Architecture | $639,000 |
| 49 | RTKL Associates | $626,000 |
| 50 | Gresham, Smith and Partners | $625,969 |
| 51 | Ware Malcomb | $608,000 |
| 52 | PageSoutherlandPage | $564,550 |
| 53 | Shepley Bulfinch Richardson & Abbott | $522,550 |
| 54 | GBBN Architects | $500,000 |
| 55 | LS3P | $487,648 |
| 56 | Perkins Eastman | $475,000 |
| 57 | Ashley McGraw Architects | $457,881 |
| 58 | Emersion Design | $435,679 |
| 59 | Smallwood, Reynolds, Stewart, Stewart & Associates | $427,939 |
| 60 | OZ Architecture | $414,466 |
| 61 | DLA Architects | $408,180 |
| 62 | Carrier Johnson + Culture | $387,386 |
| 63 | Legat Architects | $348,000 |
| 64 | Hnedak Bobo Group | $335,000 |
| 65 | VOA Associates | $324,770 |
| 66 | RSP Architects | $301,000 |
| 67 | WDG Architecture | $215,000 |
| 68 | Astorino | $209,000 |
| 69 | Environetics | $199,427 |
| 70 | FXFOWLE Architects | $184,551 |
| 71 | Niles Bolton Associates | $165,693 |
| 72 | Cambridge Seven Associates | $150,000 |
| 73 | Cooper Carry | $148,453 |
| 74 | Hoffmann Architects | $100,000 |
| 75 | Francis Cauffman | $59,377 |
| 76 | JRS Architect | $50,000 |
| 77 | DesignGroup | $18,330 |
Top Local Government Sector Engineering Firms
| Rank | Company | 2012 Local Government Revenue ($) |
| 1 | STV | $170,285,000 |
| 2 | URS Corp. | $58,897,110 |
| 3 | AECOM Technology Corp. | $50,000,000 |
| 4 | Arup | $18,981,280 |
| 5 | Smith Seckman Reid | $16,715,381 |
| 6 | Science Applications International Corp. | $15,801,804 |
| 7 | Dewberry | $9,114,869 |
| 8 | Simpson Gumpertz & Heger | $8,400,000 |
| 9 | Syska Hennessy Group | $8,141,149 |
| 10 | Walker Parking Consultants | $7,700,000 |
| 11 | Michael Baker Jr. | $6,400,000 |
| 12 | Walter P Moore | $5,367,002 |
| 13 | Clark Nexsen | $5,085,734 |
| 14 | Shive-Hattery | $4,891,919 |
| 15 | Aon Fire Protection Engineering | $3,000,000 |
| 15 | French & Parrello Associates | $3,000,000 |
| 17 | Glumac | $2,790,000 |
| 18 | M/E Engineering | $2,268,700 |
| 19 | GRAEF | $2,259,738 |
| 20 | Sparling | $2,191,493 |
| 21 | Coffman Engineers | $2,176,000 |
| 22 | TLC Engineering for Architecture | $1,985,092 |
| 23 | KJWW Engineering Consultants | $1,943,760 |
| 24 | Ross & Baruzzini | $1,881,254 |
| 25 | Thornton Tomasetti | $1,805,320 |
| 26 | Burns & McDonnell | $1,500,000 |
| 27 | Affiliated Engineers | $1,493,000 |
| 28 | WSP USA | $1,475,000 |
| 29 | Interface Engineering | $1,467,579 |
| 30 | TTG | $1,250,700 |
| 31 | Newcomb & Boyd | $1,159,914 |
| 32 | RDK Engineers | $1,147,000 |
| 33 | KPFF Consulting Engineers | $1,000,000 |
| 33 | Merrick & Co. | $1,000,000 |
| 33 | Rolf Jensen & Associates | $1,000,000 |
| 36 | Henderson Engineers | $938,172 |
| 37 | Barge, Waggoner, Sumner and Cannon | $900,000 |
| 38 | Heapy Engineering | $766,568 |
| 39 | Primera Engineers | $763,000 |
| 40 | Degenkolb Engineers | $709,034 |
| 41 | Wiss, Janney, Elstner Associates | $700,000 |
| 42 | Environmental Systems Design | $635,100 |
| 43 | ThermalTech Engineering | $625,000 |
| 44 | M-E Engineers | $600,000 |
| 45 | GHT Limited | $550,000 |
| 46 | Bridgers & Paxton Consulting Engineers | $540,170 |
| 47 | KCI Technologies | $500,000 |
| 47 | Paulus, Sokolowski and Sartor | $500,000 |
| 49 | AKF Group | $483,020 |
| 50 | Zak Companies | $443,642 |
| 51 | GRW | $422,280 |
| 52 | Buro Happold Consulting Engineers | $410,000 |
| 53 | Davis, Bowen & Friedel | $402,776 |
| 54 | Vanderweil Engineers | $399,400 |
| 55 | Bergmann Associates | $399,000 |
| 56 | Guernsey | $383,954 |
| 57 | Brinjac Engineering | $364,145 |
| 58 | Eaton Energy Solutions | $356,516 |
| 59 | H&A Architects & Engineers | $320,929 |
| 60 | CTLGroup | $300,000 |
| 61 | Dunham Associates | $290,000 |
| 62 | Apogee Consulting Group | $284,000 |
| 63 | Allen & Shariff | $240,000 |
| 64 | CJL Engineering | $215,000 |
| 65 | KLH Engineers | $200,905 |
| 66 | OLA Consulting Engineers | $200,000 |
| 67 | Haynes Whaley Associates | $163,550 |
| 68 | Wallace Engineering | $150,000 |
| 69 | Spectrum Engineers | $144,338 |
| 70 | Wick Fisher White | $137,400 |
| 71 | H.F. Lenz | $100,000 |
| 71 | Peter Basso Associates | $100,000 |
| 73 | G&W Engineering | $80,000 |
| 74 | P2S Engineering | $59,268 |
| 75 | FBA Engineering | $50,000 |
| 75 | Rist-Frost-Shumway Engineering | $50,000 |
| 77 | Total Building Commissioning | $38,192 |
| 78 | Kamm Consulting | $27,425 |
| 79 | SSOE Group | $17,850 |
Top Local Government Sector Construction Firms
| Rank | Company | 2012 Local Government Revenue ($) |
| 1 | Turner Corporation, The | $1,226,581,000 |
| 2 | Clark Group | $548,902,070 |
| 3 | PCL Construction Enterprises | $517,584,491 |
| 4 | Walsh Group, The | $450,441,105 |
| 5 | Manhattan Construction | $243,963,000 |
| 6 | Hunt Construction Group | $196,000,000 |
| 7 | Gilbane | $191,794,000 |
| 8 | McCarthy Holdings | $176,000,000 |
| 9 | Balfour Beatty | $171,637,641 |
| 10 | Skanska USA | $157,244,000 |
| 11 | Flintco | $136,000,000 |
| 12 | Tutor Perini Corporation | $133,802,102 |
| 13 | Hensel Phelps | $115,779,020 |
| 14 | Coakley & Williams Construction | $92,161,782 |
| 15 | Whiting-Turner Contracting Co., The | $91,018,874 |
| 16 | Shawmut Design and Construction | $90,000,000 |
| 17 | C.W. Driver | $82,690,564 |
| 18 | Jones Lang LaSalle | $71,807,280 |
| 19 | Messer Construction | $70,425,218 |
| 20 | O'Neil Industries/W.E. O'Neil | $66,772,883 |
| 21 | Sundt Construction | $60,800,674 |
| 22 | JE Dunn Construction | $49,135,681 |
| 23 | Holder Construction | $47,000,000 |
| 24 | Suffolk Construction | $42,967,386 |
| 25 | CORE Construction Group | $40,823,749 |
| 26 | Swinerton Builders | $38,127,950 |
| 27 | Clancy & Theys Construction | $36,766,000 |
| 28 | Layton Construction | $35,000,000 |
| 29 | Mortenson Construction | $34,582,000 |
| 30 | Walbridge | $34,000,000 |
| 31 | W. M. Jordan Co. | $32,836,071 |
| 32 | Lend Lease | $26,345,000 |
| 33 | Brasfield & Gorrie | $21,905,473 |
| 34 | Paric | $20,000,000 |
| 35 | Ryan Companies US | $18,608,330 |
| 36 | Stalco Construction | $16,800,000 |
| 37 | James McHugh Construction | $16,433,441 |
| 38 | HITT Contracting | $16,032,387 |
| 39 | Bomel Construction | $16,000,000 |
| 40 | EMJ | $15,000,000 |
| 41 | Bernards | $14,000,000 |
| 42 | Weitz Co., The | $13,000,000 |
| 43 | Choate Construction | $12,058,849 |
| 44 | Linbeck Group | $11,000,000 |
| 45 | Hill & Wilkinson General Contractors | $9,087,195 |
| 46 | IMC Construction | $8,996,480 |
| 47 | E.W. Howell | $7,924,000 |
| 48 | Yates Cos., The | $7,400,000 |
| 49 | Batson-Cook | $7,287,137 |
| 50 | Kraus-Anderson Construction | $7,000,000 |
| 51 | Structure Tone | $4,512,000 |
| 52 | Kitchell | $3,950,000 |
| 53 | S. M. Wilson & Co. | $3,052,915 |
| 54 | LPCiminelli | $2,702,059 |
| 55 | DPR Construction | $2,224,982 |
| 56 | Bette Companies, The | $2,000,000 |
| 57 | Hoar Construction | $1,173,000 |
| 58 | Hunt Companies | $920,149 |
| 59 | Hoffman Construction | $785,912 |
| 60 | New South Construction | $230,000 |
| 61 | Boldt Company, The | $153,885 |
| 62 | Power Construction | $100,000 |
| 63 | Graycor | $72,800 |
Back to Government Giants article
Read the full 2013 Giants 300 Report
Related Stories

Airports | Feb 6, 2015
Zaha Hadid-designed terminal in Beijing will be world’s largest
The terminal will accommodate 45 million passengers per year, and will be a hub for both air and rail travel.

| Jan 2, 2015
Construction put in place enjoyed healthy gains in 2014
Construction consultant FMI foresees—with some caveats—continuing growth in the office, lodging, and manufacturing sectors. But funding uncertainties raise red flags in education and healthcare.

BIM and Information Technology | Dec 28, 2014
The Big Data revolution: How data-driven design is transforming project planning
There are literally hundreds of applications for deep analytics in planning and design projects, not to mention the many benefits for construction teams, building owners, and facility managers. We profile some early successful applications.
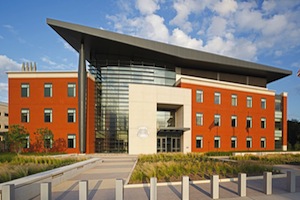
 Campus, the Building Team took advantage of the sites natural coastal g")
| Dec 28, 2014
AIA course: Enhancing interior comfort while improving overall building efficacy
Providing more comfortable conditions to building occupants has become a top priority in today’s interior designs. This course is worth 1.0 AIA LU/HSW.
| Dec 28, 2014
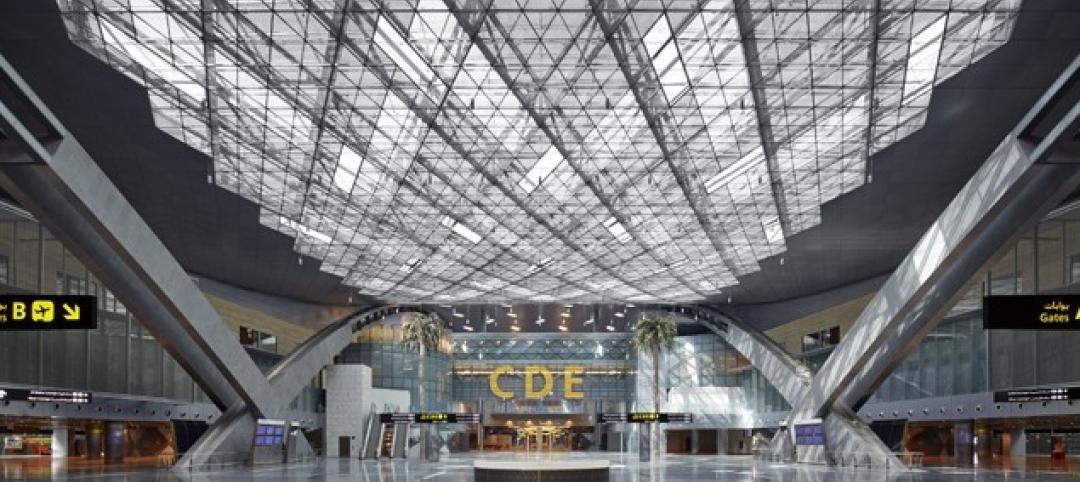
The future of airport terminal design: destination status, five-star amenities, stress-free travel
Taking a cue from the hospitality industry, airport executives are seeking to make their facilities feel more like destinations, writes HOK's Richard Gammon.
| Dec 15, 2014
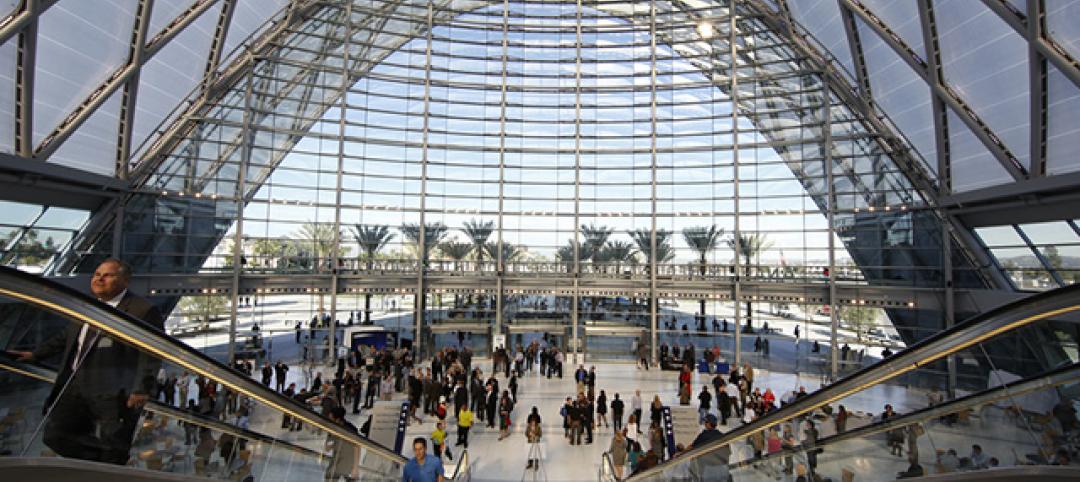
HOK-designed Anaheim Regional transit hub opens, expected to serve three million per year
ARTIC’s flexible design ensures that it can serve as a southern terminus for California’s future high-speed rail system.

| Dec 8, 2014
Moshe Safdie wants to reinvent airports with Jewel Changi Airport addition
A new addition to Singapore's Changi Airport, designed by Moshe Safdie, will feature a waterfall and extensive indoor gardens.
| Nov 19, 2014
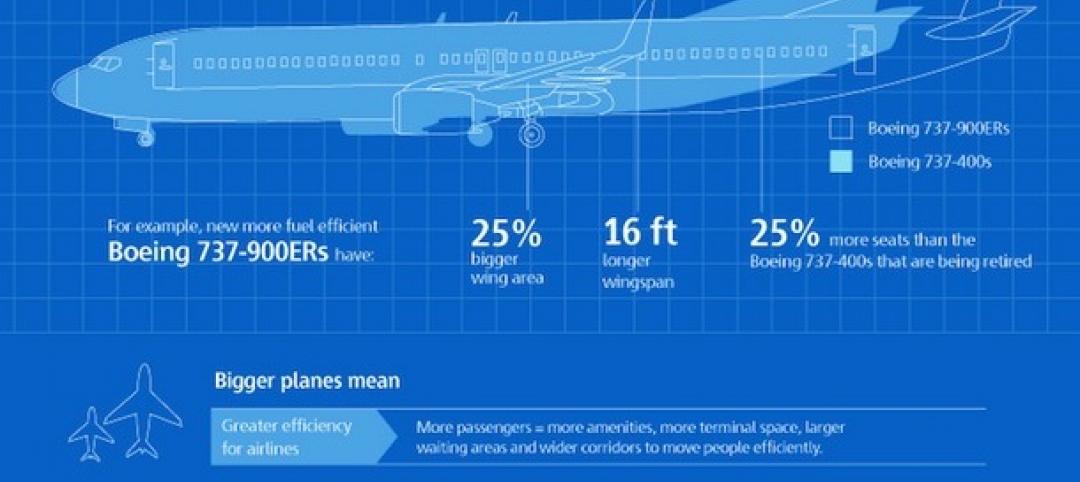
The evolution of airport design and construction [infographic]
Safety, consumer demand, and the new economics of flight are three of the major factors shaping how airlines and airport officials are approaching the need for upgrades and renovations, writes Skanska USA's MacAdam Glinn.
| Nov 18, 2014
Grimshaw releases newest designs for world’s largest airport
The airport is expected to serve 90 million passengers a year on the opening of the first phase, and more than 150 million annually after project completion in 2018.

| Nov 14, 2014
JetBlue opens Gensler-designed International Concourse at JFK
The 175,000-sf extension includes the conversion of three existing gates to international swing gates, and the addition of three new international swing gates.


