


In the third quarter of 2018, analysts at Lodging Econometrics (LE) report that the top five markets with the largest total hotel construction pipelines are: New York City with 170 projects/29,630 rooms; Dallas with 157 projects/18,954 rooms; Houston with 150 projects/16,473 rooms; Los Angeles with 141 projects/24,129 rooms; and Nashville with 115 projects/15,179 rooms.
Projects already under construction and those scheduled to start construction in the next 12 months, combined, have a total of 3,782 projects/213,798 rooms and are at cyclical highs. Markets with the greatest number of projects already in the ground and those scheduled to start construction in the next 12 months are New York with 145 projects/24,675 rooms, Dallas with 112 projects/13,854 rooms, Houston with 103 projects/11,562 rooms, Los Angeles with 92 projects/14,249 rooms, and Nashville with 88 projects/12,322 rooms.
In the third quarter, Los Angeles has the highest number of new projects announced into the pipeline with 22 projects/6,457 rooms. Detroit follows Los Angeles with 18 projects/1,937 rooms, Dallas with 14 projects/1,529 rooms, New York City with 12 projects/1,857 rooms, and then Atlanta with 12 projects/1,354 rooms.
Reflecting the strong cyclical highs in the pipeline, LE’s forecast for new hotel openings will continue to rise in 2018-2020. In 2018, New York City tops the list with 29 new hotels expected to open/5,351 rooms, Dallas with 29 projects/3,187 rooms, Houston with 27 projects/3,259 rooms, Nashville with 22 projects/3,018 rooms, and Los Angeles with 12 projects/2,152 rooms. In the 2019 forecast, New York continues to lead with the highest number of new hotels expected to open with 59 projects/8,964 rooms followed by Houston with 31 projects/3,098 rooms and Dallas with 30 projects/3,379 rooms. In 2020, Dallas is forecast to take the lead for new hotel openings with 41 projects/4,809 rooms expected to open, followed by New York with 36 projects/5,978 rooms, and Los Angeles with 33 projects/4,292 rooms expected to open.
With the exception of New York City and Houston, the other markets mentioned in the opening show that supply growth has begun to surpass demand. The variances in 2018 year-to-date are small but are certain to widen in the next two years, given the strength of these pipeline in the markets.
All in all, 10 of the top 25 markets show supply growth minimally exceeding demand growth in 2018.
Related Stories

Market Data | Jun 14, 2016
Transwestern: Market fundamentals and global stimulus driving economic growth
A new report from commercial real estate firm Transwestern indicates steady progress for the U.S. economy. Consistent job gains, wage growth, and consumer spending have offset declining corporate profits, and global stimulus plans appear to be effective.

Market Data | Jun 7, 2016
Global construction disputes took longer to resolve in 2015
The good news: the length and value of disputes in the U.S. fell last year, according to latest Arcadis report.

Market Data | Jun 3, 2016
JLL report: Retail renovation drives construction growth in 2016
Retail construction projects were up nearly 25% year-over-year, and the industrial and office construction sectors fared well, too. Economic uncertainty looms over everything, however.

Market Data | Jun 2, 2016
ABC: Nonresidential construction spending down in April
Lower building material prices, a sluggish U.S. economy, and hesitation among private developers all factor into the 2.1% drop.

Market Data | May 20, 2016
Report: Urban area population growth slows
Older Millennials are looking to buy homes and move away to more affordable suburbs and exurbs.

Market Data | May 17, 2016
Modest growth for AIA’s Architecture Billings Index in April
The American Institute of Architects reported the April ABI score was 50.6, down from the mark of 51.9 in the previous month. This score still reflects an increase in design services.

Market Data | Apr 29, 2016
ABC: Quarterly GDP growth slowest in two years
Bureau of Economic Analysis data indicates that the U.S. output is barely growing and that nonresidential investment is down.

Market Data | Apr 20, 2016
AIA: Architecture Billings Index ends first quarter on upswing
The multi-family residential sector fared the best. The Midwest was the only U.S. region that didn't see an increase in billings.
Building Technology | Apr 11, 2016
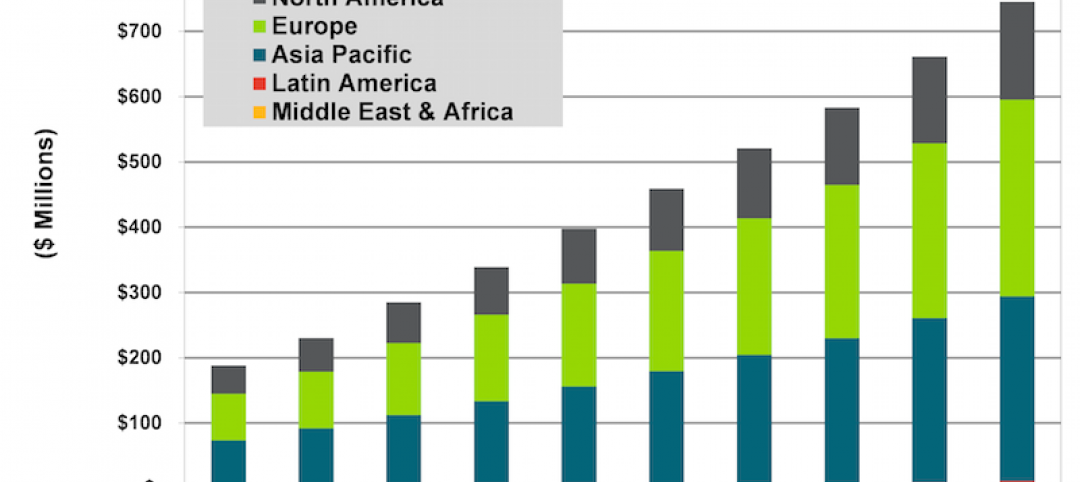
A nascent commercial wireless sensor market is poised to ascend in the next decade
Europe and Asia will propel that growth, according to a new report from Navigant.

Industry Research | Apr 7, 2016
CBRE provides latest insight into healthcare real estate investors’ strategies
Survey respondents are targeting smaller acquisitions, at a time when market cap rates are narrowing for different product types.


