

Grumman/Butkus Associates, a firm of energy efficiency consultants and sustainable design engineers, recently released the results of its 2016 Hospital Energy and Water Benchmarking Survey, focusing on healthcare facilities’ resource usage trends and costs for calendar year 2015.
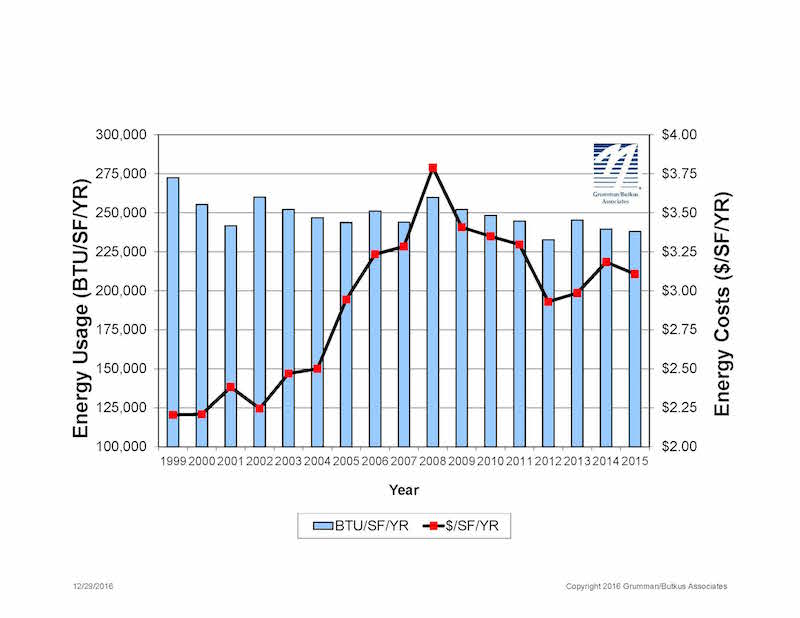
Since G/BA initiated the survey more than 20 years ago, hospitals’ overall fossil fuel use has trended downward, but electricity use isn’t declining as much. The average combined Btu/ft2 (electricity plus gas/steam) for participating facilities was 237,998 in CY2015, slightly down from 239,591 in CY2014.
Square-foot prices for gas/steam were down significantly year-to-year ($0.82 in 2015, compared with $1.02 in 2014), but square-foot prices for electricity rose ($2.28 in 2015, vs. $2.16 in 2014). The overall result is that hospitals’ total ft2 costs for energy (gas/steam plus electric) declined: $3.11 for 2015, compared with $3.18 for 2014.
Hospitals’ average carbon footprint has remained fairly steady at about 60 pounds of CO2 equivalent per ft2 per year since G/BA began calculating carbon data in 1999. “If we are going to address the very daunting issue of climate change, the healthcare industry must make greater strides in reducing its carbon footprint,” says Dan Doyle, G/BA Chairman. “As the trend data shows, not enough progress is being made so far.”
Participating facilities displayed a broad range of usage patterns. For instance, some participants are using more than 200,000 BTU/ft2 in fossil fuel annually, compared with a general mid-range of facilities (about 130,000 BTU/ft2/year) and those that used least (75,000 BTU/ft2/year or less). Similarly, a few hospitals consume more than 40 kWh/ft2/year in electricity, compared with a mid-range of about 25 kWh/ft2/year. A few squeaked by with less than 18 kWh/ft2.
“Facilities that have high unit costs for energy should view this as an opportunity,” says Doyle. “For example, an energy conservation project that would have a five-year payback at an ‘average’ facility may have a payback of just 2.5 or 3 years at a facility with higher unit costs for energy.”
Hospital water/sewer use is also gradually declining, currently averaging about 45 gallons per square foot per year (compared with nearly 70 gallons/ ft2/year a decade ago). Costs for water/sewer are rising, however, now averaging $0.39/ft2. As recently as 2007, hospitals were paying about $0.27/ft2. “G/BA expects the trend of rising water and sewer costs to continue,” says Doyle. “Price hikes not only reflect increasing costs to extract and treat the water, but also the fact that cash-strapped governmental entities may view water as a revenue source.”
Since 1995, the G/BA survey has provided a free annual benchmarking resource. Hospitals are invited to participate by submitting responses to a short list of questions. Information for this edition was provided by 137 hospitals located in Illinois (56), Wisconsin (31), Michigan (29), Indiana (10), and six other states.
Full results and analysis, as well as information about participating in the 2017 survey (2016 data), are available at the firm’s website: grummanbutkus.com/HES. For additional information, contact Dan Doyle (ddoyle@grummanbutkus.com) or Julie Higginbotham (jhigginbotham@grummanbutkus.c
Related Stories
Market Data | Sep 21, 2018
Mid-year forecast: No end in sight for growth cycle
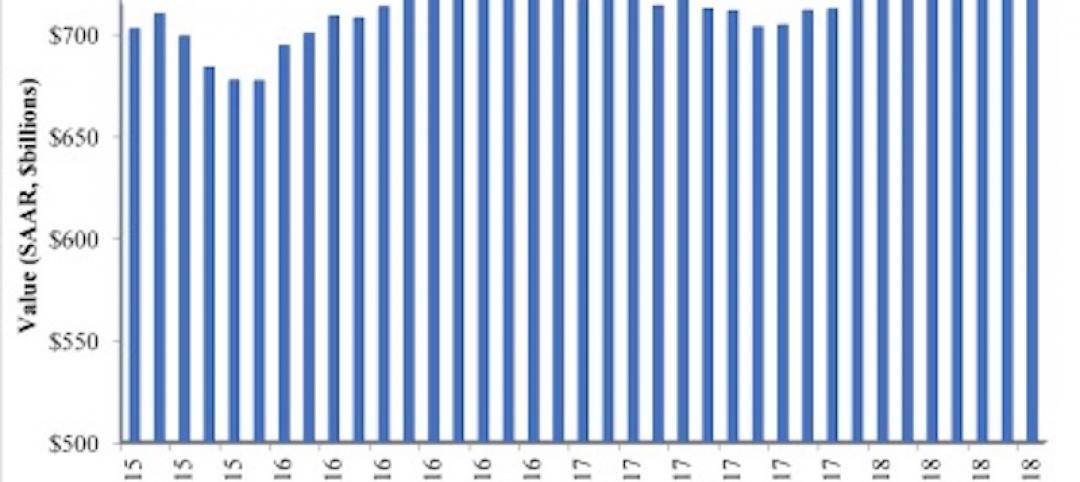
The AIA Consensus Construction Forecast is projecting 4.7% growth in nonresidential construction spending in 2018.

Market Data | Sep 19, 2018
August architecture firm billings rebound as building investment spurt continues
Southern region, multifamily residential sector lead growth.
Market Data | Sep 18, 2018
Altus Group report reveals shifts in trade policy, technology, and financing are disrupting global real estate development industry
International trade uncertainty, widespread construction skills shortage creating perfect storm for escalating project costs; property development leaders split on potential impact of emerging technologies.

Market Data | Sep 17, 2018
ABC’s Construction Backlog Indicator hits a new high in second quarter of 2018
Backlog is up 12.2% from the first quarter and 14% compared to the same time last year.

Market Data | Sep 12, 2018
Construction material prices fall in August
Softwood lumber prices plummeted 9.6% in August yet are up 5% on a yearly basis (down from a 19.5% increase year-over-year in July).
Market Data | Sep 7, 2018
Safety risks in commercial construction industry exacerbated by workforce shortages
The report revealed 88% of contractors expect to feel at least a moderate impact from the workforce shortages in the next three years.
Market Data | Sep 5, 2018
Public nonresidential construction up in July
Private nonresidential spending fell 1% in July, while public nonresidential spending expanded 0.7%.

Market Data | Aug 30, 2018
Construction in ASEAN region to grow by over 6% annually over next five years
Although there are disparities in the pace of growth in construction output among the ASEAN member states, the region’s construction industry as a whole will grow by 6.1% on an annual average basis in the next five years.
Market Data | Aug 22, 2018
July architecture firm billings remain positive despite growth slowing
Architecture firms located in the South remain especially strong.


