


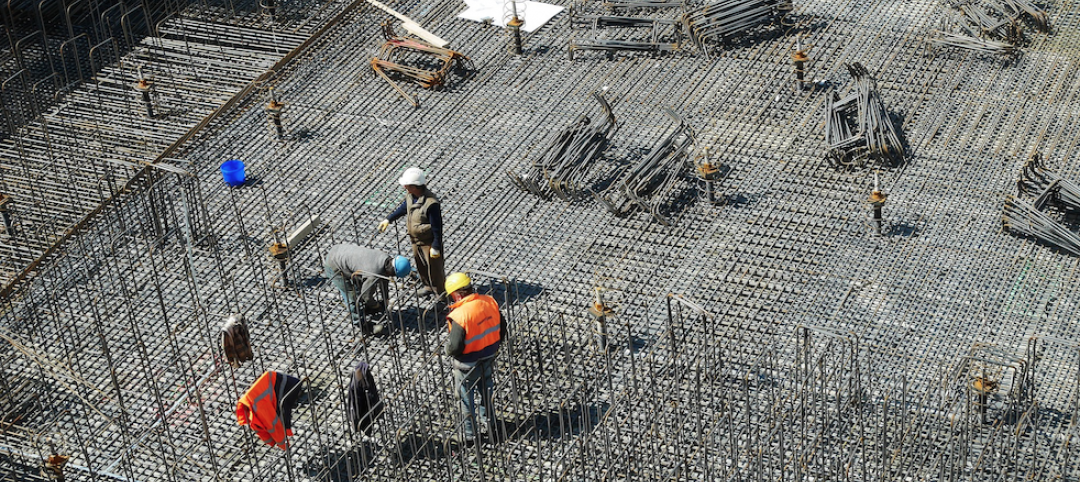
Lodging Econometrics (LE) has released its bi-annual Global Construction Pipeline Trend Report, which compiles the construction pipeline counts for every country and market around the world, states that the total global construction pipeline stands at 12,839 projects/2,158,422 rooms which are at all-time highs. The construction pipeline is up an extraordinary 86% by projects over the cyclical low established in 2011 when global counts were at 6,907 projects/1,257,296 rooms.
There are 5,988 projects/1,133,017 rooms currently under construction worldwide. Projects scheduled to start construction in the next 12 months are at 3,945 projects/570,731 rooms, both counts are at record highs. Projects in the early planning stage stand at 2,906 rooms/454,674 projects, just 134 projects short of the record high established in the fourth quarter of 2017.
The top countries by project count are the United States, which has been rising since 2011, with 5,312 projects/634,501 rooms and China with 2,523 projects/556,645 rooms which has been topping out for the last 4.5 years. The U.S. accounts for 41% of projects in the total global construction pipeline while China accounts for 20%, resulting in 61% of projects in the global pipeline being concentrated in just these two countries. Distantly following are Indonesia with 394 projects/66,759 rooms, Germany with 247 projects/47,155 rooms, and the United Kingdom with 247 projects/36,487 rooms.
The cities with the largest pipeline counts are New York with 169 projects/29,365 rooms, Dubai with 163 projects/47,783 rooms, and Dallas with 156 projects/18,908 rooms. Followed by Houston with 150 projects/16,321 rooms, and Shanghai with 121 projects/24,759 rooms. Of the top 10 cities having pipelines with more than 100 projects, 6 are located in the U.S. while 3 are located in China.
The leading 5 franchise companies in the global construction pipeline by project count are Marriott International with 2,324 projects/391,058 rooms, Hilton Worldwide with 2,202 projects/327,723 rooms, InterContinental Hotels Group (IHG) with 1,653 projects/244,038 rooms, AccorHotels with 809 projects/147,647 rooms, and Choice Hotels with 1024 projects/84,350 rooms. Hyatt, at 212 rooms/45,117 projects, is also significant with their portfolio of large luxury and upper upscale projects as well Best Western with 275 projects/29,243 rooms which are concentrated in the middle three chain scales.
The twenty-five-year explosion of hotel brands now totals 610 globally. Marriott leads with 29 labels, followed by Accor with 25, Hilton with 15, IHG and Hyatt with 12 each, and Choice with 11.
Leading pipeline brands for each of these companies are Marriott’s Fairfield Inn with 345 projects/37,224 rooms, Hilton’s Hampton Inn with 604 projects/77,193 rooms, IHG’s Holiday Inn Express with 713 projects/88,689 rooms, AccorHotels ibis Brands with 358 projects/53,387 rooms, and Choice’s Comfort with 322 projects/26,878 rooms.
As a result of record pipeline totals, new hotel openings continue to hit record levels. In 2020, totals could reach a lofty 3,000 new hotel openings, approximately 1,250 of them being in the U.S.
Related Stories

Market Data | Jun 14, 2016
Transwestern: Market fundamentals and global stimulus driving economic growth
A new report from commercial real estate firm Transwestern indicates steady progress for the U.S. economy. Consistent job gains, wage growth, and consumer spending have offset declining corporate profits, and global stimulus plans appear to be effective.

Market Data | Jun 7, 2016
Global construction disputes took longer to resolve in 2015
The good news: the length and value of disputes in the U.S. fell last year, according to latest Arcadis report.

Market Data | Jun 3, 2016
JLL report: Retail renovation drives construction growth in 2016
Retail construction projects were up nearly 25% year-over-year, and the industrial and office construction sectors fared well, too. Economic uncertainty looms over everything, however.

Market Data | Jun 2, 2016
ABC: Nonresidential construction spending down in April
Lower building material prices, a sluggish U.S. economy, and hesitation among private developers all factor into the 2.1% drop.

Market Data | May 20, 2016
Report: Urban area population growth slows
Older Millennials are looking to buy homes and move away to more affordable suburbs and exurbs.
Market Data | May 17, 2016
Modest growth for AIA’s Architecture Billings Index in April
The American Institute of Architects reported the April ABI score was 50.6, down from the mark of 51.9 in the previous month. This score still reflects an increase in design services.

Market Data | Apr 29, 2016
ABC: Quarterly GDP growth slowest in two years
Bureau of Economic Analysis data indicates that the U.S. output is barely growing and that nonresidential investment is down.

Market Data | Apr 20, 2016
AIA: Architecture Billings Index ends first quarter on upswing
The multi-family residential sector fared the best. The Midwest was the only U.S. region that didn't see an increase in billings.
Building Technology | Apr 11, 2016
A nascent commercial wireless sensor market is poised to ascend in the next decade
Europe and Asia will propel that growth, according to a new report from Navigant.
Industry Research | Apr 7, 2016
CBRE provides latest insight into healthcare real estate investors’ strategies
Survey respondents are targeting smaller acquisitions, at a time when market cap rates are narrowing for different product types.


