


A new report on office fit-out costs in North America sets out to establish a range of benchmarks for three different office styles, and to suggest what businesses favor which style.
JLL’s project and development services group, which produced the report, used data from more than 2,800 JLL-managed project budgets for over 100 clients from 17 industries in 59 markets throughout the U.S. and Canada.
The goal, says JLL, is to “elevate the conversation” around the real costs of building out various real estate designs. This year’s report includes office layout and space quality components to allow for evaluations of different office layouts, project complexities, and materials. It also provides high, medium, and low allowances for furniture, fixtures, and equipment (FFE); as well as for the installation of audio-visual and security equipment.
The result is an Office Fit Out Matrix, which shows how a handful of dynamics affect fit-out costs. Depending on the market and style, the costs range from $120.18 per sf to $216.07 per sf (see chart).
JLL breaks down these costs by region and metro market. The Northeast and Northwest consistently have higher fit-out costs. The medium costs in New York City are 28.5% above the U.S. average. In San Francisco, a fit-out would cost 22.6% more than the U.S. average. Conversely, the medium fit-out costs in West Palm Beach, Fla., are 15.9% below the national average; in Austin, Texas, 15.3% below.
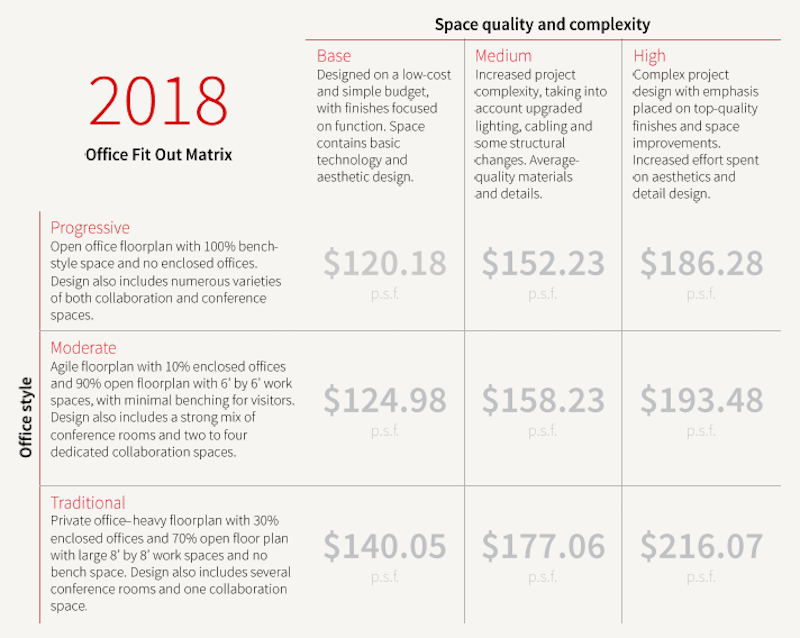
This office fit-out matrix is based on data from over 2,800 project budgets in North America that JLL managed. Image: JLL
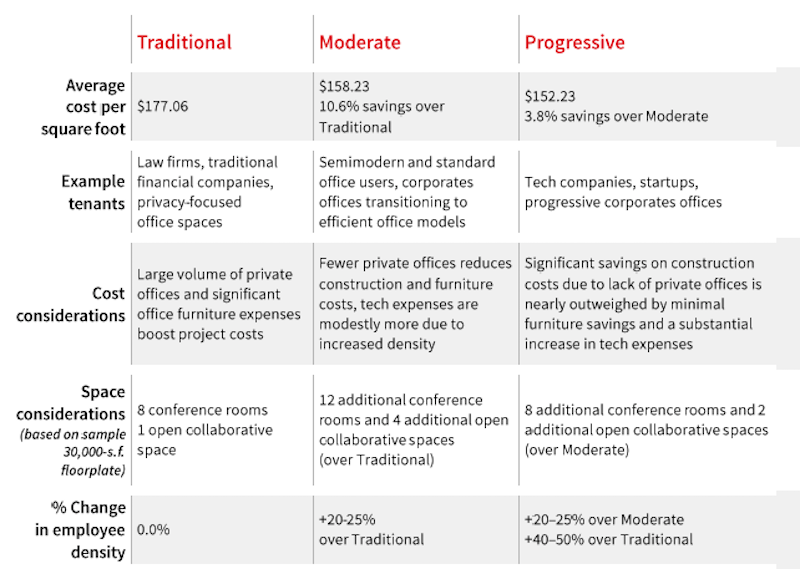
JLL's matrix compares the medium costs for fitting out three different office styles. Image: JLL
Three office styles examined
JLL divides its office fit-out costs along three styles:
• A Traditional office is still the most expensive to fit out. This style has the highest percentage of private office spaces, and typically between 20% and 50% fewer employees than the other two styles. Its FFE costs are the highest among the three styles, too. And tenant factors are “relatively small,” says JLL, because there is less common area. These offices are still favored by law firms, financial services companies, and businesses that focus on privacy with their offices.
JLL observes that some Traditional office styles are introducing lower-partition bench desks.
• A less-expensive fit-out, a Moderate office style features “agile” floorplans, with 10% dedicated to enclosed offices, and the rest of the space open with 6x6-foot workstations and minimal benching and guest space. Moderate offices—which are 20-25% less dense than Progressive office styles—include a healthy mix of conference rooms, and a few multipurpose and collaborative spaces. The hard fit-out costs for the Moderate style are average, but cost efficiencies can be captured by adding more bench-style desks.
• The Progressive office style is distinguished by an open floorplan, 100% of its desk space outfitted as bench-style furniture with zero enclosed spaces. This style’s focus is on activity-based working. Its employee density is 20-50% higher than a Traditional office, and it has double the amount of collaborative and conference spaces. (A standard plan would include 20 conference rooms and seven open collaborative/multi-use spaces.)
JLL points out that Progressive fit-outs generally have higher technology costs, but save money on FFE spending.
Landlords allowing for more upgrades
Last year, nearly 69 million sf of new office space were delivered to the market, but only 47.4% was preleased. JLL’s report observes that landlords are spending more to compete for tenants that are consistently gravitating toward high-quality spaces and assets. Consequently, landlords are offering better tenant improvement packages.
JLL cites several reasons for this trend, including the steady climb in construction costs, which increased on average by 15% last year. Landlords also offer better tenant improvement packages to offset the impact of higher rents.
The national average for tenant improvement allowances was $44 per sf, ranging from $105/sf in Washington D.C. to $28/sf in Nashville.
The report provides detailed snapshots of several markets, such as Austin, one of the country’s dynamic office markets, with robust growth supply. There are 3.1 million sf of new office space in Austin’s pipeline, 36% of which is preleased. The average tenant improvement allowance there last year was $45/sf.
There’s 7 million sf of new office space in the pipeline in San Francisco, where the office vacancy rate is 9.1%, and 68.8% of new space is preleased. The average tenant improvement allowance in San Francisco last year was $60/sf.
Related Stories
Office Buildings | Feb 13, 2024
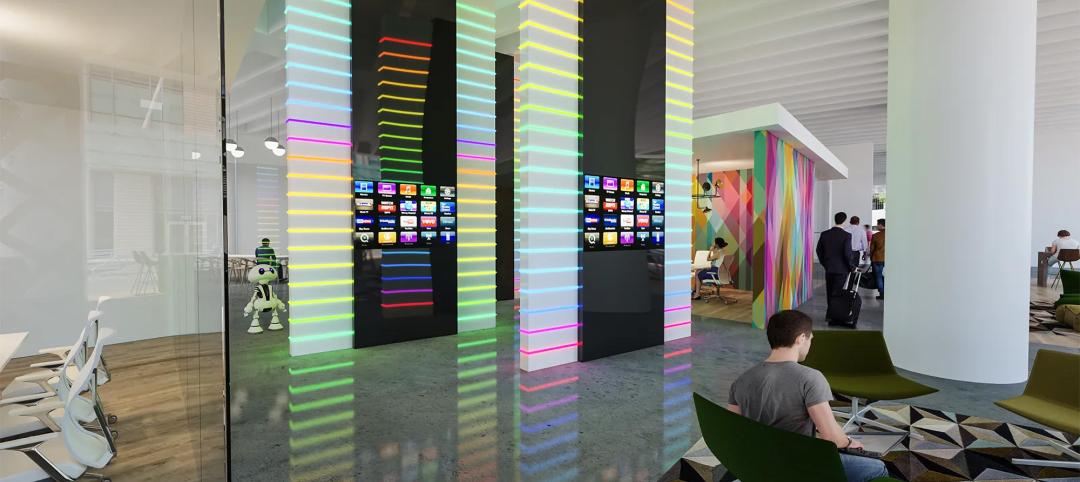
Creating thoughtful tech workplace design
It’s important for office design to be inspiring, but there are some practical principles that can be incorporated into the design of real-world tech workplaces to ensure they convey an exciting, sophisticated allure that accommodates progressive thinking and inventiveness.
Urban Planning | Feb 5, 2024
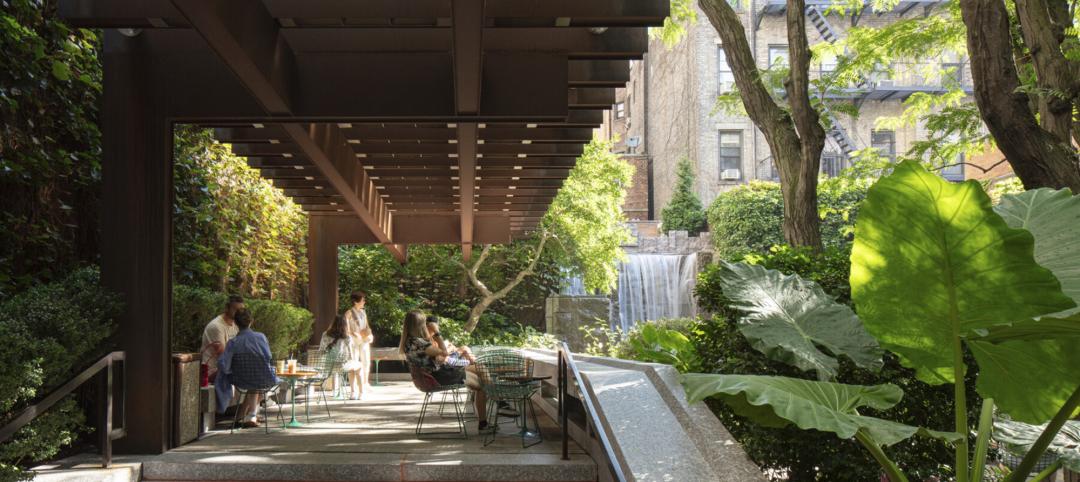
Lessons learned from 70 years of building cities
As Sasaki looks back on 70 years of practice, we’re also looking to the future of cities. While we can’t predict what will be, we do know the needs of cities are as diverse as their scale, climate, economy, governance, and culture.
Industry Research | Jan 31, 2024
ASID identifies 11 design trends coming in 2024
The Trends Outlook Report by the American Society of Interior Designers (ASID) is the first of a three-part outlook series on interior design. This design trends report demonstrates the importance of connection and authenticity.

Giants 400 | Jan 29, 2024
Top 80 Office Core and Shell Engineering Firms for 2023
Jacobs, WSP, Alfa Tech Consulting Engineers, Thornton Tomasetti, and Burns & McDonnell top BD+C's ranking of the nation's largest office core and shell engineering and engineering/architecture (EA) firms for 2023, as reported in the 2023 Giants 400 Report.

Giants 400 | Jan 29, 2024
Top 140 Office Core and Shell Architecture Firms for 2023
Gensler, Stantec, Page Southerland Page, Perkins&Will, and NBBJ top BD+C's ranking of the nation's largest office core and shell architecture and architecture engineering (AE) firms for 2023, as reported in the 2023 Giants 400 Report.

Giants 400 | Jan 29, 2024
Top 80 Workplace Interior Construction Firms for 2023
STO Building Group, HITT Contracting, Clune Construction, Hensel Phelps, and JRM Construction Management top BD+C's ranking of the nation's largest workplace interior and interior fitout general contractors and construction management (CM) firms for 2023, as reported in the 2023 Giants 400 Report.

Giants 400 | Jan 29, 2024
Top 50 Workplace Interior Engineering Firms for 2023
AECOM, Jacobs, Alfa Tech Consulting Engineers, Tetra Tech High Performance Buildings Group, and IMEG top BD+C's ranking of the nation's largest workplace interior and interior fitout engineering and engineering/architecture (EA) firms for 2023, as reported in the 2023 Giants 400 Report.

Giants 400 | Jan 29, 2024
Top 160 Workplace Interior Architecture Firms for 2023
Gensler, Interior Architects, HOK, SmithGroup, and Perkins&Will top BD+C's ranking of the nation's largest workplace interior and interior fitout architecture and architecture engineering (AE) firms for 2023, as reported in the 2023 Giants 400 Report.

Giants 400 | Jan 29, 2024
Top 100 Office Core and Shell Construction Firms for 2023
Turner Construction, AECOM, DPR Construction, Clark Group, and Clayco top BD+C's ranking of the nation's largest office core and shell general contractors and construction management (CM) firms for 2023, as reported in the 2023 Giants 400 Report.

Mixed-Use | Jan 29, 2024
12 U.S. markets where entertainment districts are under consideration or construction
The Pomp, a 223-acre district located 10 miles north of Fort Lauderdale, Fla., and The Armory, a 225,000-sf dining and entertainment venue on six acres in St Louis, are among the top entertainment districts in the works across the U.S.


