

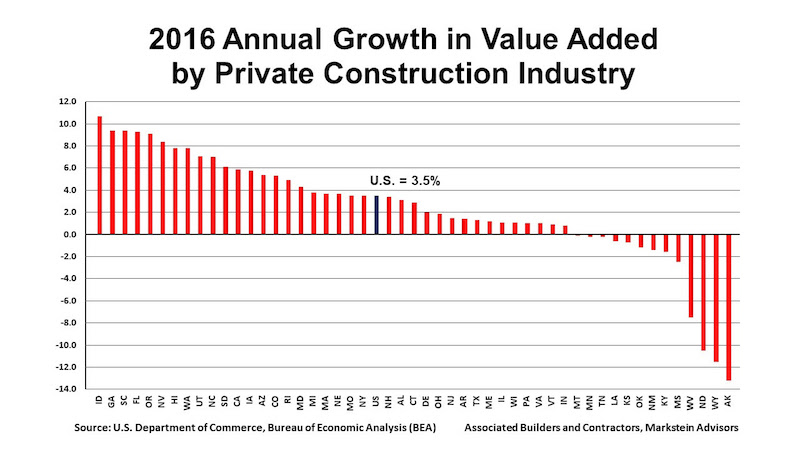
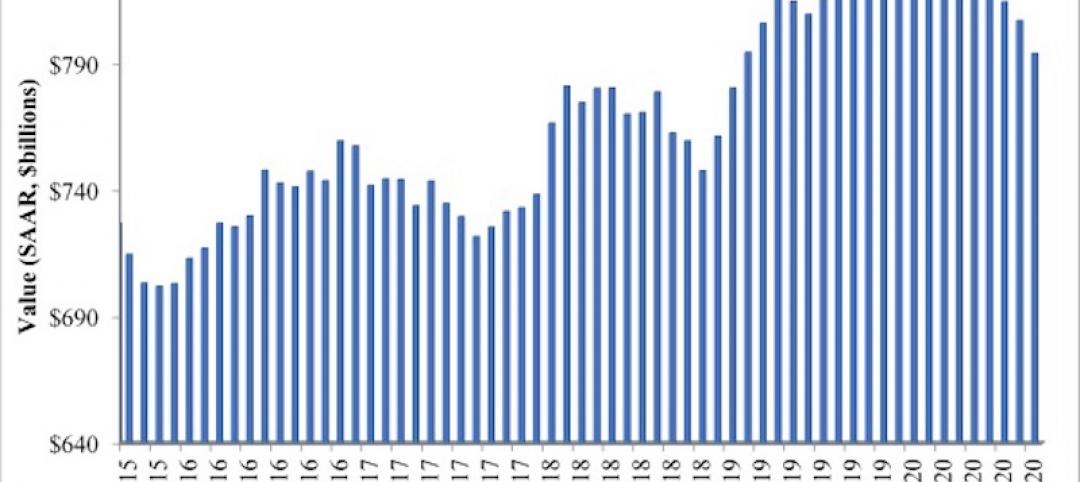
According to a report released today by Associated Builders and Contractors (ABC), the private construction industry’s value added as a percentage of the nation’s real gross domestic product (GDP) rose to 4 in 2016, the highest level since 2009. The report also shows annual growth in real construction spending, which rose 3.5% in 2016. Thirty-seven states benefited from the rise in construction activity in their state, while 13 states experienced a reduction in activity.
“Although the relative impact of the value added by private construction on various state economies varies both among states in a particular year and within a state over time, every state benefits from construction activity,” said Bernard M. Markstein, Ph.D., president and chief economist of Markstein Advisors, who conducted the analysis and prepared the report for ABC. “The increase in that activity in a particular year adds to the income and potential growth of each state. A decline in that activity acts as a drag on a state’s economic performance.”
The 3.5% national increase in real construction spending was a slowdown from the 4.9% increase in 2015. Only 18 states had a greater growth in real construction spending in 2016 compared to 2015.

2016 CONSTRUCTION SPENDING: THE TOP FIVE STATES
The fastest growth was in the West and the South. The first state outside of those two regions in the ranking of construction growth rates is Rhode Island with the 16th largest increase (up 4.9%). In 2016, the top five states for the increase in their real value added from construction in order from highest to lowest were:
1. Idaho, up 10.7%
2. Georgia and South Carolina (tie), up 9.4%
4. Florida, up 9.3%
5. Oregon, up 9.1%
Idaho had the highest percentage contribution from construction, even though state real GDP advanced a respectable, but more modest, 1.8%. Georgia slipped from its number-one ranking in 2015, while South Carolina made a significant jump from 17th to second place.
Florida’s ranking of number four is down from second place in 2015 when its real construction spending was 11.1%. Oregon saw a big improvement from 33rd place in 2015.
2016 CONSTRUCTION SPENDING: THE BOTTOM FIVE STATES
All of the bottom five states suffered from the effects of low energy prices.
46. Mississippi, down 2.5%
47. West Virginia, down 7.5%
48. North Dakota, down 10.5%
49. Wyoming, down 11.5%
50. Alaska, down 13.2%
Alaska has struggled over the last few years. Not only did it experience the largest drop in real private construction spending in 2016, but it also experienced the second largest decrease in state GDP in the nation, down 5%. Real private construction spending has been down every year starting in 2011, except for 2015 (up 0.2%).
Although Wyoming improved its 2016 ranking—it had the largest decrease in 2015 at 6.6%—the 11.5% plunge was an acceleration of a bad outcome. North Dakota had the third largest decline in its real private construction spending in 2016 and 2015, down 10.5% and 4.1%, respectively. However, the state’s growth in construction spending ranked in the top 10 from 2008 through 2014.
West Virginia had the fourth largest decline in its real private construction spending in 2016 and 2015, down 7.5% and 3.1%, respectively. Mississippi’s 2016 decrease represents a slowdown in the decline in construction from 2014 and 2015, when private construction activity fell 8.6% and 5.6%, respectively.
Read the full report here.
Related Stories
Market Data | Dec 2, 2020
Nonresidential construction spending remains flat in October
Residential construction expands as many commercial projects languish.
Market Data | Nov 30, 2020
New FEMA study projects implementing I-Codes could save $600 billion by 2060
International Code Council and FLASH celebrate the most comprehensive study conducted around hazard-resilient building codes to-date.
Market Data | Nov 23, 2020
Construction employment is down in three-fourths of states since February
This news comes even after 36 states added construction jobs in October.

Market Data | Nov 18, 2020
Architecture billings remained stalled in October
The pace of decline during October remained at about the same level as in September.

Market Data | Nov 17, 2020
Architects face data, culture gaps in fighting climate change
New study outlines how building product manufacturers can best support architects in climate action.

Market Data | Nov 10, 2020
Construction association ready to work with president-elect Biden to prepare significant new infrastructure and recovery measures
Incoming president and congress should focus on enacting measures to rebuild infrastructure and revive the economy.

Market Data | Nov 9, 2020
Construction sector adds 84,000 workers in October
A growing number of project cancellations risks undermining future industry job gains.
Market Data | Nov 4, 2020
Drop in nonresidential construction offsets most residential spending gains as growing number of contractors report cancelled projects
Association officials warn that demand for nonresidential construction will slide further without new federal relief measures.
Market Data | Nov 2, 2020
Nonresidential construction spending declines further in September
Among the sixteen nonresidential subcategories, thirteen were down on a monthly basis.

Market Data | Nov 2, 2020
A white paper assesses seniors’ access to livable communities
The Joint Center for Housing Studies and AARP’s Public Policy Institute connect livability with income, race, and housing costs.


