

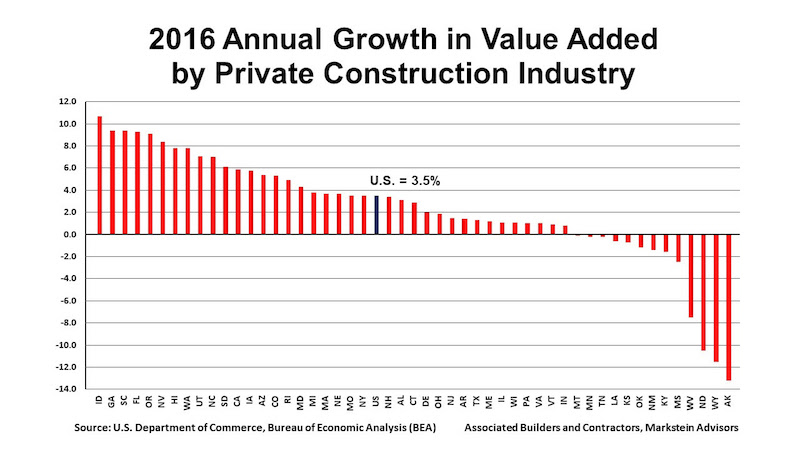
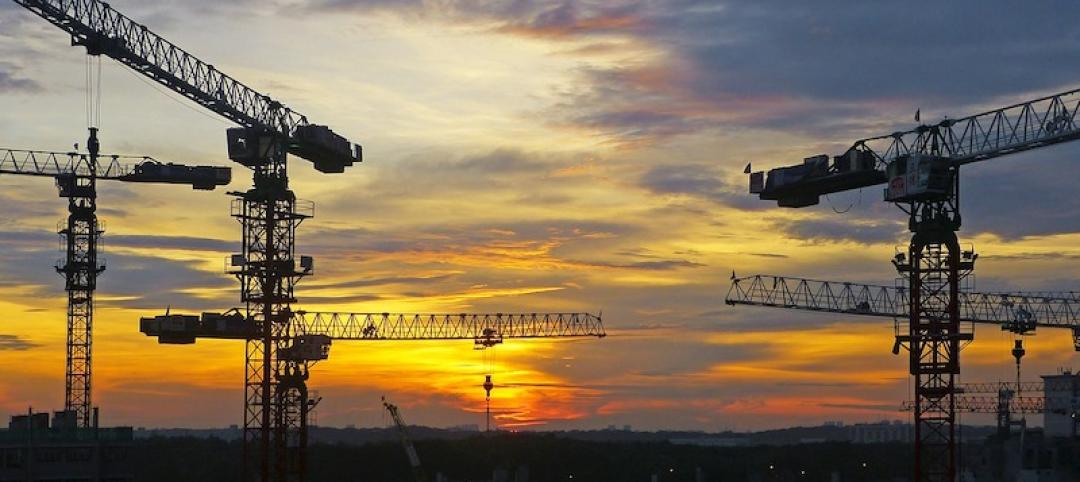
According to a report released today by Associated Builders and Contractors (ABC), the private construction industry’s value added as a percentage of the nation’s real gross domestic product (GDP) rose to 4 in 2016, the highest level since 2009. The report also shows annual growth in real construction spending, which rose 3.5% in 2016. Thirty-seven states benefited from the rise in construction activity in their state, while 13 states experienced a reduction in activity.
“Although the relative impact of the value added by private construction on various state economies varies both among states in a particular year and within a state over time, every state benefits from construction activity,” said Bernard M. Markstein, Ph.D., president and chief economist of Markstein Advisors, who conducted the analysis and prepared the report for ABC. “The increase in that activity in a particular year adds to the income and potential growth of each state. A decline in that activity acts as a drag on a state’s economic performance.”
The 3.5% national increase in real construction spending was a slowdown from the 4.9% increase in 2015. Only 18 states had a greater growth in real construction spending in 2016 compared to 2015.

2016 CONSTRUCTION SPENDING: THE TOP FIVE STATES
The fastest growth was in the West and the South. The first state outside of those two regions in the ranking of construction growth rates is Rhode Island with the 16th largest increase (up 4.9%). In 2016, the top five states for the increase in their real value added from construction in order from highest to lowest were:
1. Idaho, up 10.7%
2. Georgia and South Carolina (tie), up 9.4%
4. Florida, up 9.3%
5. Oregon, up 9.1%
Idaho had the highest percentage contribution from construction, even though state real GDP advanced a respectable, but more modest, 1.8%. Georgia slipped from its number-one ranking in 2015, while South Carolina made a significant jump from 17th to second place.
Florida’s ranking of number four is down from second place in 2015 when its real construction spending was 11.1%. Oregon saw a big improvement from 33rd place in 2015.
2016 CONSTRUCTION SPENDING: THE BOTTOM FIVE STATES
All of the bottom five states suffered from the effects of low energy prices.
46. Mississippi, down 2.5%
47. West Virginia, down 7.5%
48. North Dakota, down 10.5%
49. Wyoming, down 11.5%
50. Alaska, down 13.2%
Alaska has struggled over the last few years. Not only did it experience the largest drop in real private construction spending in 2016, but it also experienced the second largest decrease in state GDP in the nation, down 5%. Real private construction spending has been down every year starting in 2011, except for 2015 (up 0.2%).
Although Wyoming improved its 2016 ranking—it had the largest decrease in 2015 at 6.6%—the 11.5% plunge was an acceleration of a bad outcome. North Dakota had the third largest decline in its real private construction spending in 2016 and 2015, down 10.5% and 4.1%, respectively. However, the state’s growth in construction spending ranked in the top 10 from 2008 through 2014.
West Virginia had the fourth largest decline in its real private construction spending in 2016 and 2015, down 7.5% and 3.1%, respectively. Mississippi’s 2016 decrease represents a slowdown in the decline in construction from 2014 and 2015, when private construction activity fell 8.6% and 5.6%, respectively.
Read the full report here.
Related Stories
Market Data | Jun 16, 2021
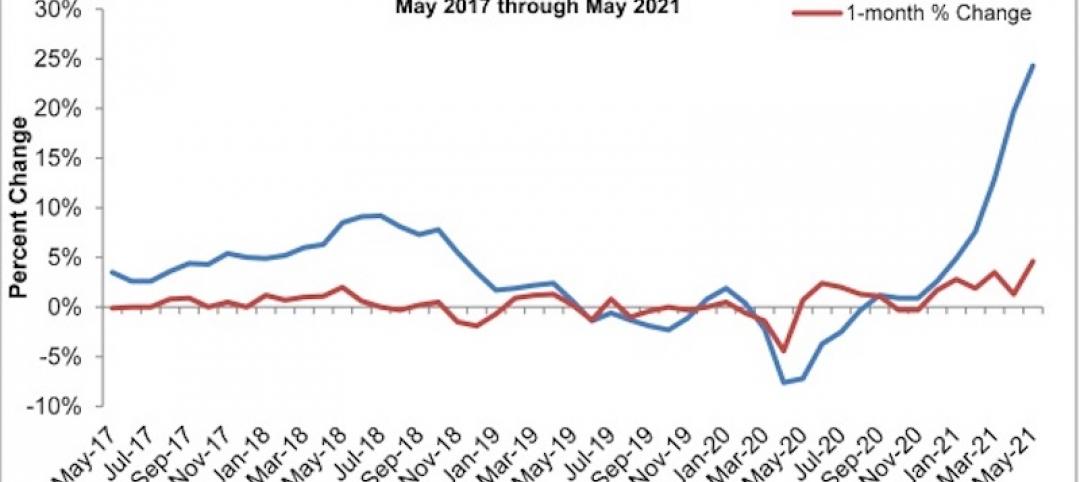
Construction input prices rise 4.6% in May; softwood lumber prices up 154% from a year ago
Construction input prices are 24.3% higher than a year ago, while nonresidential construction input prices increased 23.9% over that span.
Market Data | Jun 16, 2021
Producer prices for construction materials and services jump 24% over 12 months
The 24.3% increase in prices for materials used in construction from May 2020 to last month was nearly twice as great as in any previous year
Market Data | Jun 15, 2021
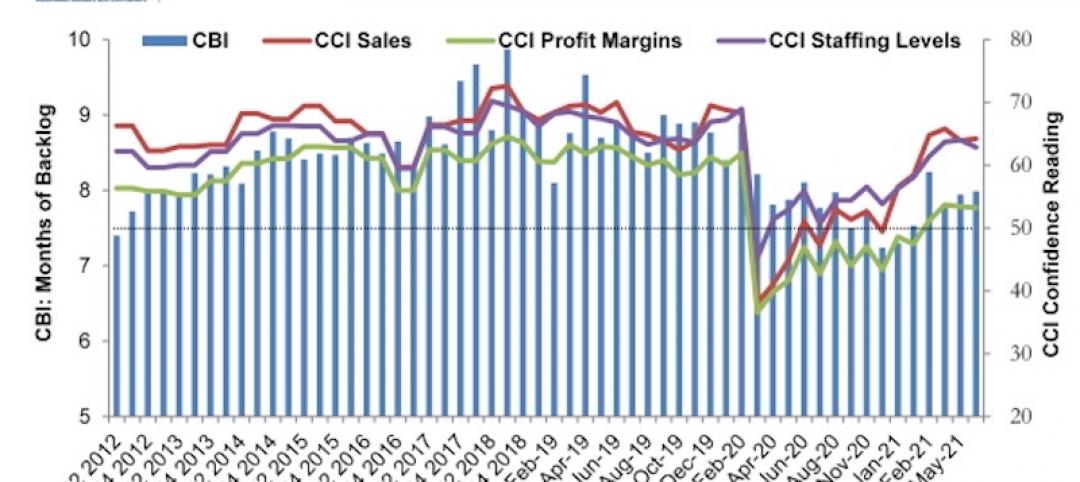
ABC’s Construction Backlog inches higher in May
Materials and labor shortages suppress contractor confidence.
Market Data | Jun 11, 2021
The countries with the most green buildings
As the country that set up the LEED initiative, the US is a natural leader in constructing green buildings.
Market Data | Jun 7, 2021
Construction employment slips by 20,000 in May
Seasonally adjusted construction employment in May totaled 7,423,000.
Market Data | Jun 2, 2021
Construction employment in April lags pre-covid February 2020 level in 107 metro areas
Houston-The Woodlands-Sugar Land and Odessa, Texas have worst 14-month construction job losses.
Market Data | Jun 1, 2021
Nonresidential construction spending decreases 0.5% in April
Spending was down on a monthly basis in nine of 16 nonresidential subcategories.
Market Data | Jun 1, 2021
Nonresidential construction outlays drop in April to two-year low
Public and private work declines amid supply-chain woes, soaring costs.
Market Data | May 24, 2021
Construction employment in April remains below pre-pandemic peak in 36 states and D.C.
Texas and Louisiana have worst job losses since February 2020, while Utah and Idaho are the top gainers.
Market Data | May 19, 2021
Design activity strongly increases
Demand signals construction is recovering.


