


A total of 6,645 planned and ongoing construction projects by the world’s megacities, valued at US$4.2trn and fueled by the increase in population, are sparking interest in residential and infrastructural developments, according to GlobalData.
The United Nations predicts that, between 2016 and 2030, the percentage of the world's population living in cities with at least a million inhabitants is likely to grow from 23% to 27%, and the number of megacities is projected to increase from 31 to 41.
Following a recent assessment of project pipelines in major cities worldwide by GlobalData, a listing of 50 ‘Construction Mega Cities’, discovers they each have a pipeline of projects with an investment value above US$30bn.
The report states that Dubai tops the list with total project values amounting to US$374.2bn, just ahead of London in second place with US$328.7bn and Moscow in third with US$191.5bn. However, the Asia-Pacific region dominates the list, accounting for 25 of the 50 cities, and having a combined projects pipeline valued at US$1.7trn.
Yasmine Ghozzi, Economist at GlobalData, comments, “The ranking of Construction Mega Cities in the Gulf states shows they are spending the most on major development projects relative to the size of their populations. Dubai, for example, has a population of 3.2m, but it holds the top position in terms of the value of the construction mega-projects pipeline per capita.
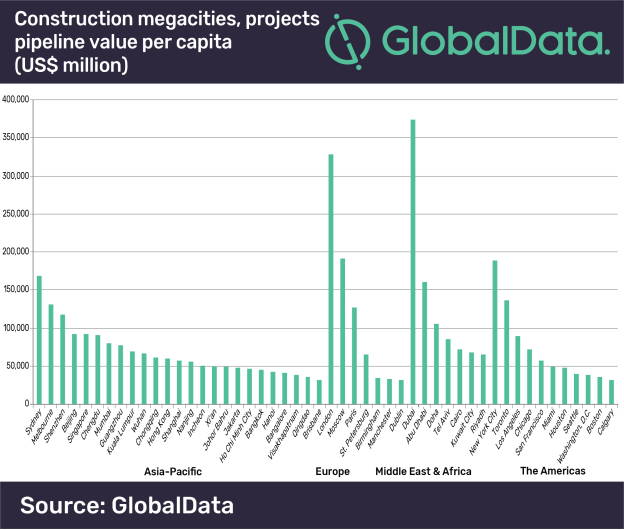
“In addition, the number of people living in Doha has increased to 1.1m as the Gulf state recruits tens of thousands of workers to work on major infrastructure projects linked to the 2022 FIFA World Cup; their project pipeline valued at US$105.6bn.”
There are major differences among the 50 Construction Mega Cities in terms of the value of the project pipelines compared to the size of the economies. Visakhapatnam, one of India's largest ports and an important industrial town and seaside resort, tops the ranking primarily owing to the government’s push on infrastructure and affordable housing.
Ghozzi continues, “The two main cities in Vietnam, Hanoi and Ho Chi Minh City, also feature in the top 10 ranking of cities in terms of the value of the project pipeline in relation to the city’s economy. Ho Chi Minh City’s economy recorded high economic growth in the first six months of 2018, with the construction industry recording growth of 7.7%. The city is expected to grow by around 8.8% a year, ahead of Hanoi (8%) and many other major cities in the region – outside of China and India – between 2018 and 2022.”
Related Stories

Market Data | Apr 6, 2017
Architecture marketing: 5 tools to measure success
We’ve identified five architecture marketing tools that will help your firm evaluate if it’s on the track to more leads, higher growth, and broader brand visibility.

Market Data | Apr 3, 2017
Public nonresidential construction spending rebounds; overall spending unchanged in February
The segment totaled $701.9 billion on a seasonally adjusted annualized rate for the month, marking the seventh consecutive month in which nonresidential spending sat above the $700 billion threshold.

Market Data | Mar 29, 2017
Contractor confidence ends 2016 down but still in positive territory
Although all three diffusion indices in the survey fell by more than five points they remain well above the threshold of 50, which signals that construction activity will continue to be one of the few significant drivers of economic growth.

Market Data | Mar 24, 2017
These are the most and least innovative states for 2017
Connecticut, Virginia, and Maryland are all in the top 10 most innovative states, but none of them were able to claim the number one spot.

Market Data | Mar 22, 2017
After a strong year, construction industry anxious about Washington’s proposed policy shifts
Impacts on labor and materials costs at issue, according to latest JLL report.

Market Data | Mar 22, 2017
Architecture Billings Index rebounds into positive territory
Business conditions projected to solidify moving into the spring and summer.

Market Data | Mar 15, 2017
ABC's Construction Backlog Indicator fell to end 2016
Contractors in each segment surveyed all saw lower backlog during the fourth quarter, with firms in the heavy industrial segment experiencing the largest drop.

Market Data | Feb 28, 2017
Leopardo’s 2017 Construction Economics Report shows year-over-year construction spending increase of 4.2%
The pace of growth was slower than in 2015, however.

Market Data | Feb 23, 2017
Entering 2017, architecture billings slip modestly
Despite minor slowdown in overall billings, commercial/ industrial and institutional sectors post strongest gains in over 12 months.

Market Data | Feb 16, 2017
How does your hospital stack up? Grumman/Butkus Associates 2016 Hospital Benchmarking Survey
Report examines electricity, fossil fuel, water/sewer, and carbon footprint.


