

A total of 6,645 planned and ongoing construction projects by the world’s megacities, valued at US$4.2trn and fueled by the increase in population, are sparking interest in residential and infrastructural developments, according to GlobalData.
The United Nations predicts that, between 2016 and 2030, the percentage of the world's population living in cities with at least a million inhabitants is likely to grow from 23% to 27%, and the number of megacities is projected to increase from 31 to 41.
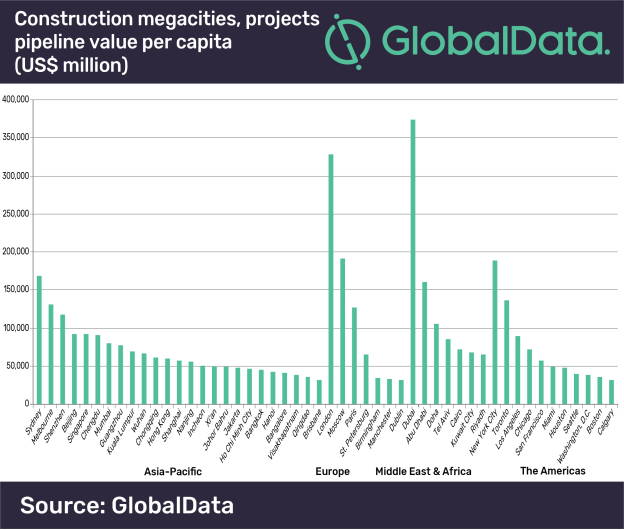
Following a recent assessment of project pipelines in major cities worldwide by GlobalData, a listing of 50 ‘Construction Mega Cities’, discovers they each have a pipeline of projects with an investment value above US$30bn.
The report states that Dubai tops the list with total project values amounting to US$374.2bn, just ahead of London in second place with US$328.7bn and Moscow in third with US$191.5bn. However, the Asia-Pacific region dominates the list, accounting for 25 of the 50 cities, and having a combined projects pipeline valued at US$1.7trn.
Yasmine Ghozzi, Economist at GlobalData, comments, “The ranking of Construction Mega Cities in the Gulf states shows they are spending the most on major development projects relative to the size of their populations. Dubai, for example, has a population of 3.2m, but it holds the top position in terms of the value of the construction mega-projects pipeline per capita.
“In addition, the number of people living in Doha has increased to 1.1m as the Gulf state recruits tens of thousands of workers to work on major infrastructure projects linked to the 2022 FIFA World Cup; their project pipeline valued at US$105.6bn.”
There are major differences among the 50 Construction Mega Cities in terms of the value of the project pipelines compared to the size of the economies. Visakhapatnam, one of India's largest ports and an important industrial town and seaside resort, tops the ranking primarily owing to the government’s push on infrastructure and affordable housing.
Ghozzi continues, “The two main cities in Vietnam, Hanoi and Ho Chi Minh City, also feature in the top 10 ranking of cities in terms of the value of the project pipeline in relation to the city’s economy. Ho Chi Minh City’s economy recorded high economic growth in the first six months of 2018, with the construction industry recording growth of 7.7%. The city is expected to grow by around 8.8% a year, ahead of Hanoi (8%) and many other major cities in the region – outside of China and India – between 2018 and 2022.”
Related Stories

Market Data | Aug 2, 2022
Nonresidential construction spending falls 0.5% in June, says ABC
National nonresidential construction spending was down by 0.5% in June, according to an Associated Builders and Contractors analysis of data published today by the U.S. Census Bureau.

Market Data | Jul 28, 2022
The latest Beck Group report sees earlier project collaboration as one way out of the inflation/supply chain malaise
In the first six months of 2022, quarter-to-quarter inflation for construction materials showed signs of easing, but only slightly.

Hotel Facilities | Jul 28, 2022
As travel returns, U.S. hotel construction pipeline growth follows
According to the recently released United States Construction Pipeline Trend Report from Lodging Econometrics (LE), the total U.S. construction pipeline stands at 5,220 projects/621,268 rooms at the close of 2022’s second quarter, up 9% Year-Over-Year (YOY) by projects and 4% YOY by rooms.

Codes and Standards | Jul 22, 2022
Hurricane-resistant construction may be greatly undervalued
New research led by an MIT graduate student at the school’s Concrete Sustainability Hub suggests that the value of buildings constructed to resist wind damage in hurricanes may be significantly underestimated.

Market Data | Jul 21, 2022
Architecture Billings Index continues to stabilize but remains healthy
Architecture firms reported increasing demand for design services in June, according to a new report today from The American Institute of Architects (AIA).

Market Data | Jul 21, 2022
Despite deteriorating economic conditions, nonresidential construction spending projected to increase through 2023
Construction spending on buildings is projected to increase just over nine percent this year and another six percent in 2023, according to a new report from the American Institute of Architects (AIA).

Building Team | Jul 18, 2022
Understanding the growing design-build market
FMI’s new analysis of the design-build market forecast for the next fives years shows that this delivery method will continue to grow, despite challenges from the COVID-19 pandemic.

Market Data | Jul 1, 2022
Nonresidential construction spending slightly dips in May, says ABC
National nonresidential construction spending was down by 0.6% in May, according to an Associated Builders and Contractors analysis of data published today by the U.S. Census Bureau.

Market Data | Jun 30, 2022
Yardi Matrix releases new national rent growth forecast
Rents in most American cities continue to rise slightly each month, but are not duplicating the rapid escalation rates exhibited in 2021.

Market Data | Jun 22, 2022
Architecture Billings Index slows but remains strong
Architecture firms reported increasing demand for design services in May, according to a new report today from The American Institute of Architects (AIA).


