

Construction employment in June remained below the levels reached before the pre-pandemic peak in February 2020 in 39 states, according to an analysis by the Associated General Contractors of America of government employment data released today. Association officials noted that many construction firms are struggling to cope with supply chain challenges and rising materials prices, which is undermining demand for new projects and impacting firms’ ability to hire new workers.
“The construction industry is a long way from full recovery in most states, in spite of a hot homebuilding market in many areas,” said Ken Simonson, the association’s chief economist. “Soaring materials costs, long production times for key items, and delayed deliveries are causing owners to postpone projects.”
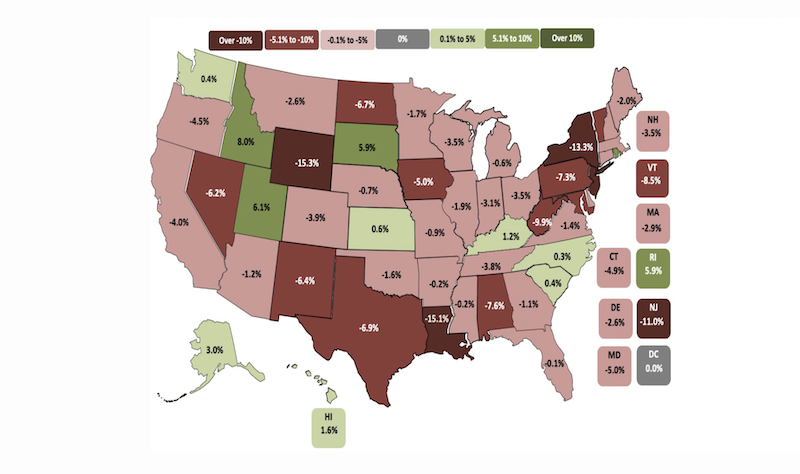
From February 2020—the month before the pandemic caused project shutdowns and cancellations—to last month, construction employment increased in only 11 states and was flat in the District of Columbia. New York shed the most construction jobs over the period (-54,300 jobs or -13.3%), followed by Texas (-54,100 jobs, -6.9%) and California (-36,500 jobs, -4.0%). Wyoming recorded the largest percentage loss (-15.3%, -3,500 jobs), followed by Louisiana (-15.1%, -20,700 jobs) and New York.
Of the states that added construction jobs since February 2020, Utah added the most (7,000 jobs, 6.1%), followed by Idaho (4,400 jobs, 8.0%), South Dakota (1,400 jobs, 5.9%) and Rhode Island (1,200 jobs, 5.9%). The largest percentage gain was in Idaho, followed by Utah, Rhode Island, and South Dakota.
From May to June construction employment decreased in 25 states, increased in 24 states and D.C., and held steady in Maine. The largest decline over the month occurred in New York, which lost 6,900 construction jobs or 1.9%, followed by Pennsylvania (-4,100 jobs, -1.6%) and Texas (-3,300 jobs, -1.3%). The steepest percentage declines since May occurred in Vermont (-3.5%, -500 jobs), followed by New York, Alabama (-1.9%, -1,700 jobs), and North Dakota (-1.9%, -500 jobs).
Georgia added the most construction jobs between May and June (5,700 jobs, 2.9%), followed by Kentucky (2,700 jobs, 3.4%) and Florida (2,500 jobs, 0.4%). Kentucky had the largest percentage gain for the month, followed by Alaska (3.0%, 500 jobs) and Georgia.
Association officials cautioned that construction employment is unlikely to grow in many parts of the country until many of the supply chain challenges impacting firms improve. They added that the President could help by removing tariffs on key construction materials. They added that ending the unemployment supplements would add to the pool of workers for manufacturers, shippers, and construction firms to hire.
“Easing tariffs will help, but what the construction supply chain needs are workers to manufacture the products, ship them to contractors and build the projects the economy demands,” said Stephen E. Sandherr, the association’s chief executive officer. “Unemployment supplements helped families survive the pandemic-related lock downs, but they are undermining the post-pandemic recovery.”
View state February 2020-June 2021 data, 16-month rankings, 1-month rankings, and map.
Related Stories

Market Data | Apr 4, 2016
ABC: Nonresidential spending slip in February no cause for alarm
Spending in the nonresidential sector totaled $690.3 billion on a seasonally adjusted, annualized basis in February. The figure is a step back but still significantly higher than one year ago.

Market Data | Mar 30, 2016
10 trends for commercial real estate: JLL report
The report looks at global threats and opportunities, and how CRE firms are managing their expectations for growth.

Market Data | Mar 23, 2016
AIA: Modest expansion for Architecture Billings Index
Business conditions softening most in Midwest in recent months.

Retail Centers | Mar 16, 2016
Food and technology will help tomorrow’s malls survive, says CallisonRTKL
CallisonRTKL foresees future retail centers as hubs with live/work/play components.

Market Data | Mar 6, 2016
Real estate execs measure success by how well they manage ‘talent,’ costs, and growth
A new CBRE survey finds more companies leaning toward “smarter” workspaces.

Market Data | Mar 1, 2016
ABC: Nonresidential spending regains momentum in January
Nonresidential construction spending expanded 2.5% on a monthly basis and 12.3% on a yearly basis, totaling $701.9 billion. Spending increased in January in 10 of 16 nonresidential construction sectors.

Market Data | Mar 1, 2016
Leopardo releases 2016 Construction Economics Report
This year’s report shows that spending in 2015 reached the highest level since the Great Recession. Total spending on U.S. construction grew 10.5% to $1.1 trillion, the largest year-over-year gain since 2007.

Market Data | Feb 26, 2016
JLL upbeat about construction through 2016
Its latest report cautions about ongoing cost increases related to finding skilled laborers.

Market Data | Feb 17, 2016
AIA reports slight contraction in Architecture Billings Index
Multifamily residential sector improving after sluggish 2015.

Market Data | Feb 11, 2016
AIA: Continued growth expected in nonresidential construction
The American Institute of Architects’ semi-annual Consensus Construction Forecast indicates a growth of 8% in construction spending in 2016, and 6.7% the following year.


