

Construction employment increased from May to June in 31 states and the District of Columbia, but the gains may have stalled, according to an analysis by the Associated General Contractors of America of government employment data released today and a compilation of weekly jobsite hours by construction technology firm Procore. Association officials urged officials in Washington to promptly enact funding for infrastructure projects and plug looming state and local budget deficits to head off a new round of job losses.
“The widespread job gains in June follow even more universal increases in May,” said Ken Simonson, the association’s chief economist. “But the government’s employment snapshot was based on payrolls during the week of June 12. More recent data collected by Procore on hours worked on jobsites suggests employment topped out around mid-June and may have begun to decline.”
Simonson observed that users of Procore’s software record the number of hours worked each week on their construction job sites. Procore reported that jobsite hours reached a peak of 15.1 million during the week of June 7-13. Since then, preliminary totals have slipped, to 15.0 million during the week of June 14-20 and 14.6 million during the week of June 21-27.
Procore has been mapping total jobsite hours in each state since the week of March 1, around the time of the initial restrictions on businesses in some states. Jobsite hours have increased in most states as shutdown orders were relaxed and the weather grew more favorable for construction in many locations. Nevertheless, in 12 states Procore users logged fewer jobsite hours in late June than in early March, Simonson noted.
New York added the most construction jobs from May to June (42,000 jobs or 14.2%). Massachusetts had the largest percentage increase (16.3%, 19,700 construction jobs). Construction employment declined from May to June in 18 states and was unchanged in Alaska. Louisiana lost the most construction jobs (-3,900 jobs, -3.1%). Nevada had the highest percentage loss (-3.5%, -3,500 jobs).
From June 2019 to June 2020, construction employment increased in 15 states, decreased in 34 states and D.C., and held steady in Wyoming. Utah added the most construction jobs over the year (10,200 jobs, 9.4%). South Dakota had the largest percentage increase (13.7%, 3,200 jobs). Both states set all-time highs, in records dating to 1990. New York lost the most construction jobs over the year (68,300 jobs, -16.8%). The largest percentage decline occurred in Vermont (-29.4%, -4,500 jobs).
Association officials warned that recent flare-ups of coronavirus across most states mean there will soon be more project cancellations, forcing contractors to lay off workers again. They urged Congress and the Trump administration to promptly enact new infrastructure funding measures and backfill the massive budget gaps that have opened in state and local government budgets, so that public construction does not decline precipitously.
“Only the federal government has the means to keep infrastructure and other needed public construction on track,” said Stephen E. Sandherr, the association’s chief executive officer. “It would be tragic to miss the opportunity to support the economy, keep thousands of construction employees at work, and invest in much-needed upgrades to roads, transportation facilities, water and sewer systems.”
View the state employment data, 12-mo, 1-mo rankings, map and high and lows. Click here for Procore’s data.
Related Stories
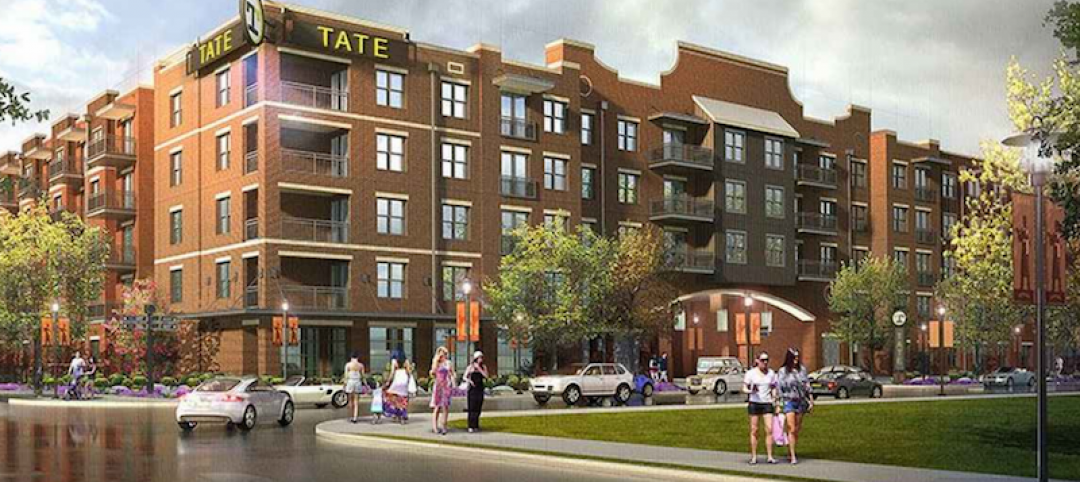
Multifamily Housing | Aug 12, 2016
Apartment completions in largest metros on pace to increase by 50% in 2016
Texas is leading this multifamily construction boom, according to latest RENTCafé estimates.
Market Data | Jul 29, 2016
ABC: Output expands, but nonresidential fixed investment falters
Nonresidential fixed investment fell for a third consecutive quarter, as indicated by Bureau of Economic Analysis data.
Industry Research | Jul 26, 2016
AIA consensus forecast sees construction spending on rise through next year
But several factors could make the industry downshift.

Architects | Jul 20, 2016
AIA: Architecture Billings Index remains on solid footing
The June ABI score was down from May, but the figure was positive for the fifth consecutive month.

Market Data | Jul 7, 2016
Airbnb alleged to worsen housing crunch in New York City
Allegedly removing thousands of housing units from market, driving up rents.

Market Data | Jul 6, 2016
Construction spending falls 0.8% from April to May
The private and public sectors have a combined estimated seasonally adjusted annual rate of $1.14 trillion.
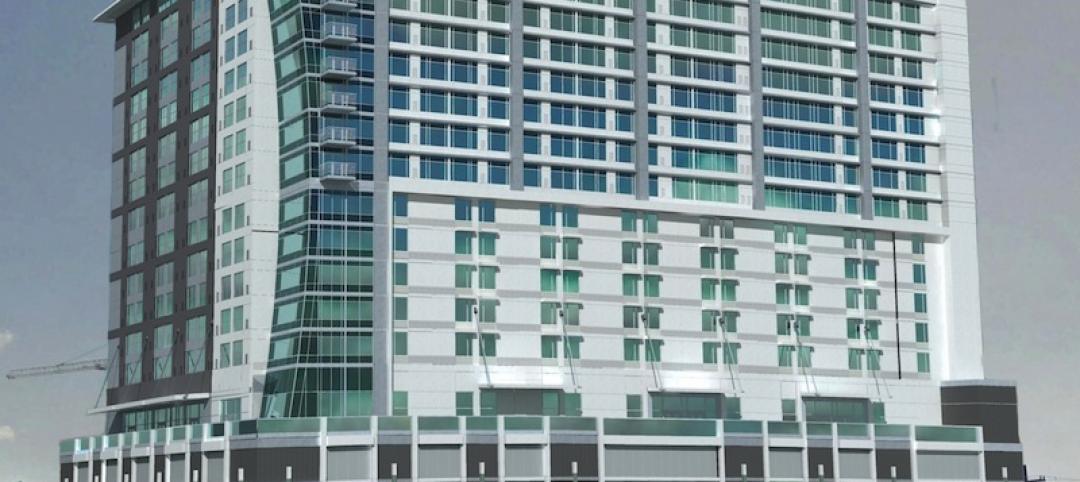
Market Data | Jul 6, 2016
A thriving economy and influx of businesses spur construction in downtown Seattle
Development investment is twice what it was five years ago.

Multifamily Housing | Jul 5, 2016
Apartments continue to shrink, rents continue to rise
Latest survey by RENTCafé tracks size changes in 95 metros.

Multifamily Housing | Jun 22, 2016
Can multifamily construction keep up with projected demand?
The Joint Center for Housing Studies’ latest disection of America’s housing market finds moderate- and low-priced rentals in short supply.
Contractors | Jun 21, 2016
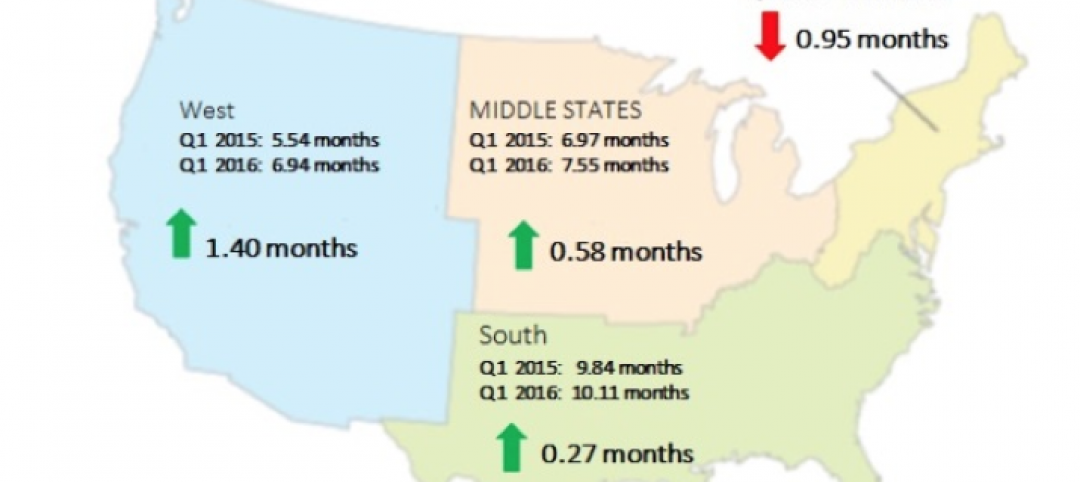
Bigness counts when it comes to construction backlogs
Large companies that can attract talent are better able to commit to more work, according to a national trade group for builders and contractors.


