

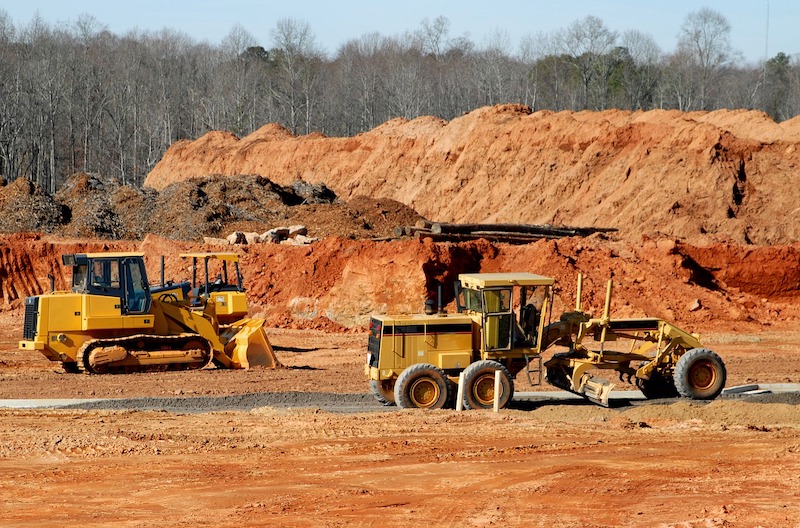
Construction employment increased from May to June in 31 states and the District of Columbia, but the gains may have stalled, according to an analysis by the Associated General Contractors of America of government employment data released today and a compilation of weekly jobsite hours by construction technology firm Procore. Association officials urged officials in Washington to promptly enact funding for infrastructure projects and plug looming state and local budget deficits to head off a new round of job losses.
“The widespread job gains in June follow even more universal increases in May,” said Ken Simonson, the association’s chief economist. “But the government’s employment snapshot was based on payrolls during the week of June 12. More recent data collected by Procore on hours worked on jobsites suggests employment topped out around mid-June and may have begun to decline.”
Simonson observed that users of Procore’s software record the number of hours worked each week on their construction job sites. Procore reported that jobsite hours reached a peak of 15.1 million during the week of June 7-13. Since then, preliminary totals have slipped, to 15.0 million during the week of June 14-20 and 14.6 million during the week of June 21-27.
Procore has been mapping total jobsite hours in each state since the week of March 1, around the time of the initial restrictions on businesses in some states. Jobsite hours have increased in most states as shutdown orders were relaxed and the weather grew more favorable for construction in many locations. Nevertheless, in 12 states Procore users logged fewer jobsite hours in late June than in early March, Simonson noted.
New York added the most construction jobs from May to June (42,000 jobs or 14.2%). Massachusetts had the largest percentage increase (16.3%, 19,700 construction jobs). Construction employment declined from May to June in 18 states and was unchanged in Alaska. Louisiana lost the most construction jobs (-3,900 jobs, -3.1%). Nevada had the highest percentage loss (-3.5%, -3,500 jobs).
From June 2019 to June 2020, construction employment increased in 15 states, decreased in 34 states and D.C., and held steady in Wyoming. Utah added the most construction jobs over the year (10,200 jobs, 9.4%). South Dakota had the largest percentage increase (13.7%, 3,200 jobs). Both states set all-time highs, in records dating to 1990. New York lost the most construction jobs over the year (68,300 jobs, -16.8%). The largest percentage decline occurred in Vermont (-29.4%, -4,500 jobs).
Association officials warned that recent flare-ups of coronavirus across most states mean there will soon be more project cancellations, forcing contractors to lay off workers again. They urged Congress and the Trump administration to promptly enact new infrastructure funding measures and backfill the massive budget gaps that have opened in state and local government budgets, so that public construction does not decline precipitously.
“Only the federal government has the means to keep infrastructure and other needed public construction on track,” said Stephen E. Sandherr, the association’s chief executive officer. “It would be tragic to miss the opportunity to support the economy, keep thousands of construction employees at work, and invest in much-needed upgrades to roads, transportation facilities, water and sewer systems.”
View the state employment data, 12-mo, 1-mo rankings, map and high and lows. Click here for Procore’s data.
Related Stories

Hotel Facilities | Jul 28, 2022
As travel returns, U.S. hotel construction pipeline growth follows
According to the recently released United States Construction Pipeline Trend Report from Lodging Econometrics (LE), the total U.S. construction pipeline stands at 5,220 projects/621,268 rooms at the close of 2022’s second quarter, up 9% Year-Over-Year (YOY) by projects and 4% YOY by rooms.

Codes and Standards | Jul 22, 2022
Hurricane-resistant construction may be greatly undervalued
New research led by an MIT graduate student at the school’s Concrete Sustainability Hub suggests that the value of buildings constructed to resist wind damage in hurricanes may be significantly underestimated.

Market Data | Jul 21, 2022
Architecture Billings Index continues to stabilize but remains healthy
Architecture firms reported increasing demand for design services in June, according to a new report today from The American Institute of Architects (AIA).

Market Data | Jul 21, 2022
Despite deteriorating economic conditions, nonresidential construction spending projected to increase through 2023
Construction spending on buildings is projected to increase just over nine percent this year and another six percent in 2023, according to a new report from the American Institute of Architects (AIA).

Building Team | Jul 18, 2022
Understanding the growing design-build market
FMI’s new analysis of the design-build market forecast for the next fives years shows that this delivery method will continue to grow, despite challenges from the COVID-19 pandemic.

Market Data | Jul 1, 2022
Nonresidential construction spending slightly dips in May, says ABC
National nonresidential construction spending was down by 0.6% in May, according to an Associated Builders and Contractors analysis of data published today by the U.S. Census Bureau.

Market Data | Jun 30, 2022
Yardi Matrix releases new national rent growth forecast
Rents in most American cities continue to rise slightly each month, but are not duplicating the rapid escalation rates exhibited in 2021.

Market Data | Jun 22, 2022
Architecture Billings Index slows but remains strong
Architecture firms reported increasing demand for design services in May, according to a new report today from The American Institute of Architects (AIA).

Building Team | Jun 17, 2022
Data analytics in design and construction: from confusion to clarity and the data-driven future
Data helps virtual design and construction (VDC) teams predict project risks and navigate change, which is especially vital in today’s fluctuating construction environment.

Market Data | Jun 15, 2022
ABC’s construction backlog rises in May; contractor confidence falters
Associated Builders and Contractors reports today that its Construction Backlog Indicator increased to nine months in May from 8.8 months in April, according to an ABC member survey conducted May 17 to June 3. The reading is up one month from May 2021.


