

Construction employment decreased from December 2019 to December 2020 in more than half of the nation’s metro areas despite a surge in homebuilding and remodeling, according to an analysis of new government data that the Associated General Contractors of America released today. Association officials said large numbers of contractors are having to lay off workers once they complete projects that began before the pandemic because private owners and public agencies are hesitant to commit to new construction.
“A dearth of new construction work is forcing more and more contractors to lay off employees once they complete projects started before the pandemic hit in early 2020,” said Ken Simonson, the association’s chief economist. “Private nonresidential construction spending tumbled 10% from December 2019 to December 2020 and public work has been slowing since last March, according to recent Census Bureau data.”
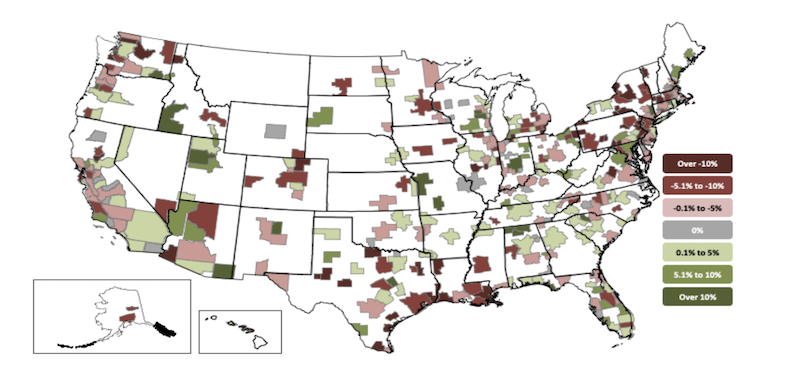
Construction employment fell in 191, or 53%, of 358 metro areas in 2020. Construction employment was stagnant in 33 additional metro areas, while only 134 metro areas—37%—added construction jobs between December 2019 and December 2020.
Houston-The Woodlands-Sugar Land, Texas lost the largest number of construction jobs in 2020 (-24,500 jobs, -10%), followed by New York City (-19,100 jobs, -12%); Midland, Texas (-9,200 jobs, -23%); Montgomery-Bucks-Chester counties, Pa. (-9,100 jobs, -17%); and Denver-Aurora-Lakewood, Colo. (-6,900 jobs, -6%). Brockton-Bridgewater-Easton, Mass. had the largest percentage decline (-40%, -2,100 jobs), followed by Altoona, Pa. (-34%, -1,000 jobs); Bloomsburg-Berwick, Pa. (-33%, -400 jobs); Johnstown, Pa. (-29%, -700 jobs); and East Stroudsburg, Pa. (-26%, -500 jobs).
Indianapolis-Carmel-Anderson, Ind. added the most construction jobs over the year (5,600 jobs, 10%), followed by Northern Virginia (5,300 jobs, 7%); Seattle-Bellevue-Everett, Wash. (4,900 jobs, 5%); Baltimore-Columbia-Towson, Md. (4,800 jobs, 6%); and Kansas City, Mo. (3,300 jobs, 11%). Walla Walla, Wash. had the highest percentage increase (17%, 200 jobs), followed by Fond du Lac, Wisc. (16%, 500 jobs); Springfield, Mo. (15%, 1,400 jobs); and Dutchess-Putnam counties, N.Y.
(15%, 1,300 jobs).
Association officials said job losses are likely to widen as demand for non-residential construction suffers and state and local budget challenges undermine demand for public projects. They urged Washington officials to begin work on recovery measures to fund infrastructure and shore up local construction budgets. They added that the work on these new investments should start even as negotiations on a coronavirus relief package continue.
“Helping people now is important but planning to rebuild our economy is essential to recovering from the economic pain of the pandemic,” said Stephen E. Sandherr, the association’s chief executive officer. “It is not enough to just want a better economy; you have to build it.”
View the metro employment 12-month data, rankings, top 10, new highs and lows, map.
Related Stories

Market Data | Apr 4, 2016
ABC: Nonresidential spending slip in February no cause for alarm
Spending in the nonresidential sector totaled $690.3 billion on a seasonally adjusted, annualized basis in February. The figure is a step back but still significantly higher than one year ago.

Market Data | Mar 30, 2016
10 trends for commercial real estate: JLL report
The report looks at global threats and opportunities, and how CRE firms are managing their expectations for growth.

Market Data | Mar 23, 2016
AIA: Modest expansion for Architecture Billings Index
Business conditions softening most in Midwest in recent months.

Retail Centers | Mar 16, 2016
Food and technology will help tomorrow’s malls survive, says CallisonRTKL
CallisonRTKL foresees future retail centers as hubs with live/work/play components.

Market Data | Mar 6, 2016
Real estate execs measure success by how well they manage ‘talent,’ costs, and growth
A new CBRE survey finds more companies leaning toward “smarter” workspaces.

Market Data | Mar 1, 2016
ABC: Nonresidential spending regains momentum in January
Nonresidential construction spending expanded 2.5% on a monthly basis and 12.3% on a yearly basis, totaling $701.9 billion. Spending increased in January in 10 of 16 nonresidential construction sectors.

Market Data | Mar 1, 2016
Leopardo releases 2016 Construction Economics Report
This year’s report shows that spending in 2015 reached the highest level since the Great Recession. Total spending on U.S. construction grew 10.5% to $1.1 trillion, the largest year-over-year gain since 2007.

Market Data | Feb 26, 2016
JLL upbeat about construction through 2016
Its latest report cautions about ongoing cost increases related to finding skilled laborers.

Market Data | Feb 17, 2016
AIA reports slight contraction in Architecture Billings Index
Multifamily residential sector improving after sluggish 2015.

Market Data | Feb 11, 2016
AIA: Continued growth expected in nonresidential construction
The American Institute of Architects’ semi-annual Consensus Construction Forecast indicates a growth of 8% in construction spending in 2016, and 6.7% the following year.


