

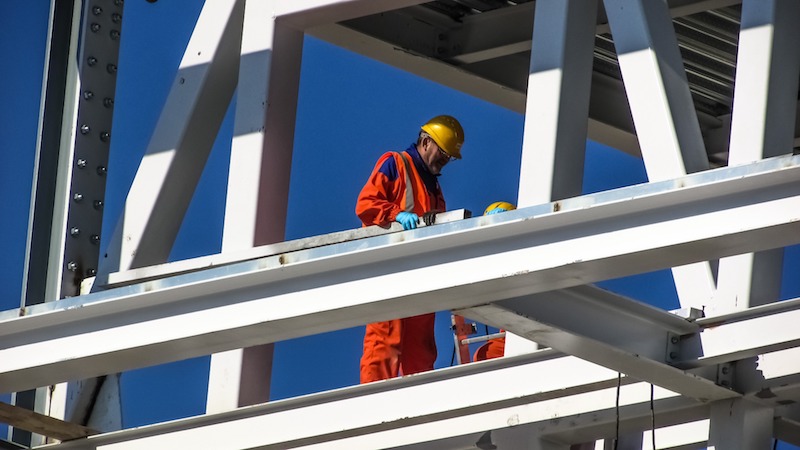
The resolution of global construction disputes remained steady in 2016, and the average time it took to resolve those disputes declined bit, according to the seventh annual Arcadis Global Construction Disputes Report 2017, which is subtitled “Avoiding the Same Pitfalls.”
This report reflects the construction disputes that Arcadis’ team handled around the world. The report infers that the roadblocks to expeditious and less cost dispute resolution often stem from the need for better contract administration, robust documentation, and a proactive approach to risk management.
“Our industry contains the best problem solvers in the world,” the report states. “But there often seems to be a lack of ability or willingness of the project participants to compromise and resolve disputes at the earliest and most inexpensive stage possible.” Roy Cooper, Senior Vice President of Arcadis Contract Solutions, attributes disputes to “human emotions that can impede settlements, as they do with physical factors such as differing site conditions and design errors.”
The world’s economic expansion generally is not seen as an impediment to resolving contract disputes. Global growth is projected at 3.5% in 2017, and 3.6% in 2018, according to the International Monetary Fund.
While the outlook is positive, the report sees risks in labor contraction, increasing commodities prices, and uncertain immigration policies. “A potential widening of global imbalances, coupled with sharp currency exchange rate movements, should those occur in response to major policy shifts, could further intensify protectionist pressures.”
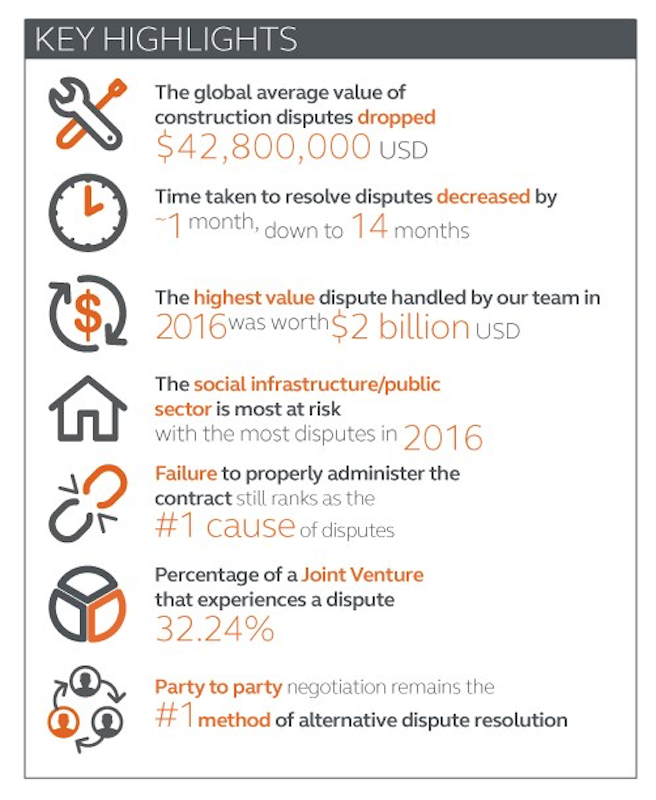
A summary of Arcadis' findings for 2016. Image: Arcadis US
That being said, the global average construction dispute value declined in 2016 by nearly 7% to US$42.8 million (and that includes one US$2 billion dispute Arcadis handled). Asia averaged the highest dispute value, at US$84 million, and the United Kingdom saw a double-digit increase in its average dispute value, to US$34 million.
The global average length of a dispute also fell slightly last year, to 14 months. North America’s dispute duration was the longest of all Arcadis’ regions, an average of 15.6 months. For the third consecutive year, the most common cause for disputes in North America in 2016 was errors and/or omissions in the contract documentation.
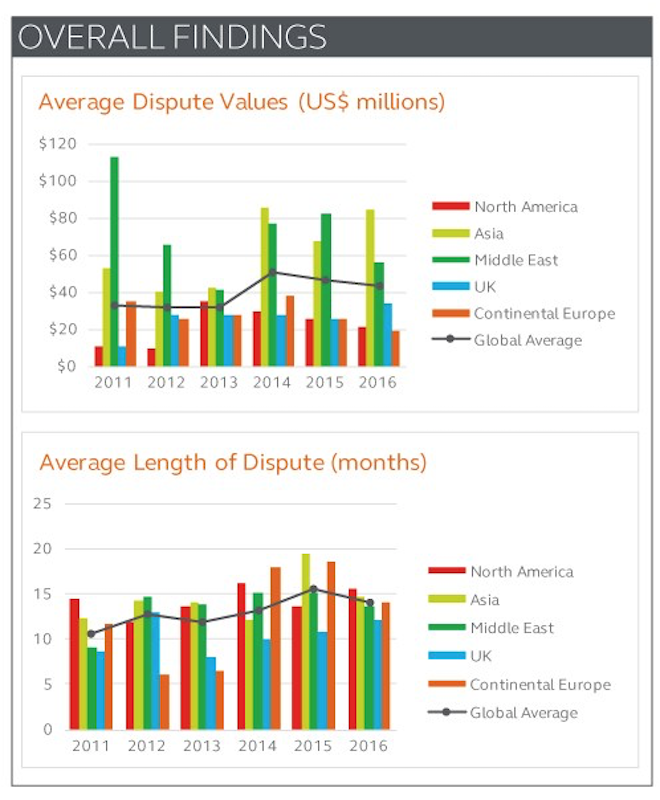
Asia had the highest average dispute value last year; North America the longest time it took to resolve a dispute. Image: Arcadis
Globally, Arcadis identifies failure to properly administer a contract among the five most common causes of disputes, along with poorly drafted or incomplete/unsubstantiated claims; the failure of an employer, contractor or subcontractor to understand or comply with its contractual obligations; errors and omissions in the contract; and incomplete design information or employer requires.
The most common methods to resolve construction disputes were, in order of preference, party-to-party negotiation, arbitration, and mediation.
And the most important activities to avoid disputes were led by proper contract administration, accurate documents, and fair and appropriate risk and balances in contracts.
Related Stories

Market Data | Mar 29, 2017
Contractor confidence ends 2016 down but still in positive territory
Although all three diffusion indices in the survey fell by more than five points they remain well above the threshold of 50, which signals that construction activity will continue to be one of the few significant drivers of economic growth.

Market Data | Mar 24, 2017
These are the most and least innovative states for 2017
Connecticut, Virginia, and Maryland are all in the top 10 most innovative states, but none of them were able to claim the number one spot.

Market Data | Mar 22, 2017
After a strong year, construction industry anxious about Washington’s proposed policy shifts
Impacts on labor and materials costs at issue, according to latest JLL report.

Market Data | Mar 22, 2017
Architecture Billings Index rebounds into positive territory
Business conditions projected to solidify moving into the spring and summer.

Market Data | Mar 15, 2017
ABC's Construction Backlog Indicator fell to end 2016
Contractors in each segment surveyed all saw lower backlog during the fourth quarter, with firms in the heavy industrial segment experiencing the largest drop.

Market Data | Feb 28, 2017
Leopardo’s 2017 Construction Economics Report shows year-over-year construction spending increase of 4.2%
The pace of growth was slower than in 2015, however.

Market Data | Feb 23, 2017
Entering 2017, architecture billings slip modestly
Despite minor slowdown in overall billings, commercial/ industrial and institutional sectors post strongest gains in over 12 months.

Market Data | Feb 16, 2017
How does your hospital stack up? Grumman/Butkus Associates 2016 Hospital Benchmarking Survey
Report examines electricity, fossil fuel, water/sewer, and carbon footprint.

Market Data | Feb 1, 2017
Nonresidential spending falters slightly to end 2016
Nonresidential spending decreased from $713.1 billion in November to $708.2 billion in December.

Market Data | Jan 31, 2017
AIA foresees nonres building spending increasing, but at a slower pace than in 2016
Expects another double-digit growth year for office construction, but a more modest uptick for health-related building.


