

Providing more evidence of a strengthening economy, Associated Builders and Contractors’ (ABC) Construction Backlog Indicator (CBI) set a record as it expanded to 9.45 months during the third quarter of 2017, up 9.8 percent from the second quarter to the longest backlog reading in the eight-year history of the series. CBI is up by 0.8 months, or 9.2 percent, on a year-over-year basis.
CBI is a leading economic indicator that reflects the amount of construction work under contract, but not yet completed. CBI is measured in months, with a lengthening backlog implying expanding demand for construction services.
“The latest backlog reading strongly suggests the post-2009 economic recovery is picking up steam and that the current construction spending cycle, in place since early 2011 for many contractors, is not on the verge of concluding,” said Basu. “Indeed, if anything, the CBI indicates that nonresidential construction firms are becoming busier due to a confluence of factors, including growing business confidence over the past year and a recent rise in energy prices, which is supporting more investment among energy explorers, producers and distributors.
“With economic growth picking up recently, interest rates staying low, asset prices remaining high and confidence elevated among consumers and businesses alike, the nonresidential construction cycle stands to get even hotter in the near term. That should represent a source of joy to contractors, but undoubtedly many are unnerved by growing pressures to secure suitably trained craftspeople who can support on-time, on-budget project delivery. The upshot is that wage pressures will continue to build in the U.S. construction industry. However, based on the most recent CBI, increasing delivery costs have not yet begun to meaningfully slow the nonresidential construction sector’s ongoing expansion cycle.”

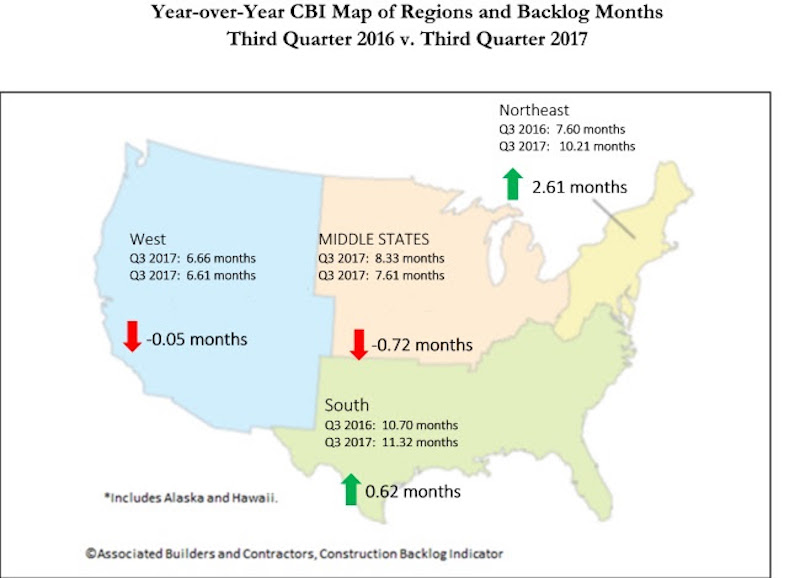
Highlights by Region
⦁ Backlog in the South surged to 11.3 months during the third quarter, the highest reading in the history of the series. Many will conclude that this is at least partially due to the storms that raced across Texas, Florida and other communities during the quarter, but there are other factors at work, including the ongoing boom in commercial construction in the Dallas, Atlanta and Miami metropolitan areas.
⦁ Increased activity in major cities along the Boston-to-Washington corridor continued to drive backlog data higher in the Northeast. At 10.2 months, the Northeast has matched its lengthiest backlog in the history of the series, in the fourth quarter of 2014.
⦁ Backlog in the Middle States, where growth has been softer in places like Illinois and Kansas, shrank by 0.3 months during the third quarter. Still, regional backlog can be characterized as stable.
⦁ Backlog in the West was slightly shorter during the third quarter and stands at roughly the same level as one year ago. Given the elevated levels of construction apparent in markets like Las Vegas, Portland and San Jose, one can only conclude that the region’s lower average backlog level compared to other regions is at least partially attributable to a very competitive environment associated with an entrepreneurial climate that spawns more start-up construction firms than other parts of the country. Wildfires impacting much of California also likely stalled a certain level of construction and contractual activity during the third quarter.

Highlights by Industry
⦁ Backlog in the commercial/institutional segment expanded briskly, increasing by nearly a full month during the third quarter, and now stands at 9.31 months.
⦁ Average backlog in the heavy industrial category fell to 4.46 months during the third quarter, continuing what has been two years of steady shrinkage aligned with observed declines in construction spending related to U.S. manufacturing.
⦁ Backlog in the infrastructure category expanded during the third quarter to 12.53 months, the highest reading on record for the segment and an indication that improving state and local government finances may finally be translating into higher capital spending.
Highlights by Company Size
⦁ Large firms, those with annual revenues in excess of $100 million, experienced a collective average backlog increase to 13.8 months during the third quarter. Despite the sharp quarterly rise, backlog in the category is virtually unchanged from the same time one year ago.
⦁ Backlog among firms with annual revenues between $50 million and $100 million also surged during the third quarter, increasing by more than two months. Backlog in this category stands at levels last observed in 2013 when the construction recovery began to heat up in earnest.
⦁ Backlog among firms with between $30 million and $50 million in annual revenues lengthened modestly to 11.4 months during the third quarter, the third highest reading on record.
⦁ Backlog for firms with annual revenues less than $30 million remain remarkably stable at 7.7 months. For the past eleven quarters, backlog for this group, which is heavily tilted toward subcontractors, has remained between 7.2 and 8.1 months.
Related Stories

Market Data | Jun 14, 2016
Transwestern: Market fundamentals and global stimulus driving economic growth
A new report from commercial real estate firm Transwestern indicates steady progress for the U.S. economy. Consistent job gains, wage growth, and consumer spending have offset declining corporate profits, and global stimulus plans appear to be effective.

Market Data | Jun 7, 2016
Global construction disputes took longer to resolve in 2015
The good news: the length and value of disputes in the U.S. fell last year, according to latest Arcadis report.

Market Data | Jun 3, 2016
JLL report: Retail renovation drives construction growth in 2016
Retail construction projects were up nearly 25% year-over-year, and the industrial and office construction sectors fared well, too. Economic uncertainty looms over everything, however.

Market Data | Jun 2, 2016
ABC: Nonresidential construction spending down in April
Lower building material prices, a sluggish U.S. economy, and hesitation among private developers all factor into the 2.1% drop.

Market Data | May 20, 2016
Report: Urban area population growth slows
Older Millennials are looking to buy homes and move away to more affordable suburbs and exurbs.
Market Data | May 17, 2016
Modest growth for AIA’s Architecture Billings Index in April
The American Institute of Architects reported the April ABI score was 50.6, down from the mark of 51.9 in the previous month. This score still reflects an increase in design services.

Market Data | Apr 29, 2016
ABC: Quarterly GDP growth slowest in two years
Bureau of Economic Analysis data indicates that the U.S. output is barely growing and that nonresidential investment is down.

Market Data | Apr 20, 2016
AIA: Architecture Billings Index ends first quarter on upswing
The multi-family residential sector fared the best. The Midwest was the only U.S. region that didn't see an increase in billings.
Building Technology | Apr 11, 2016
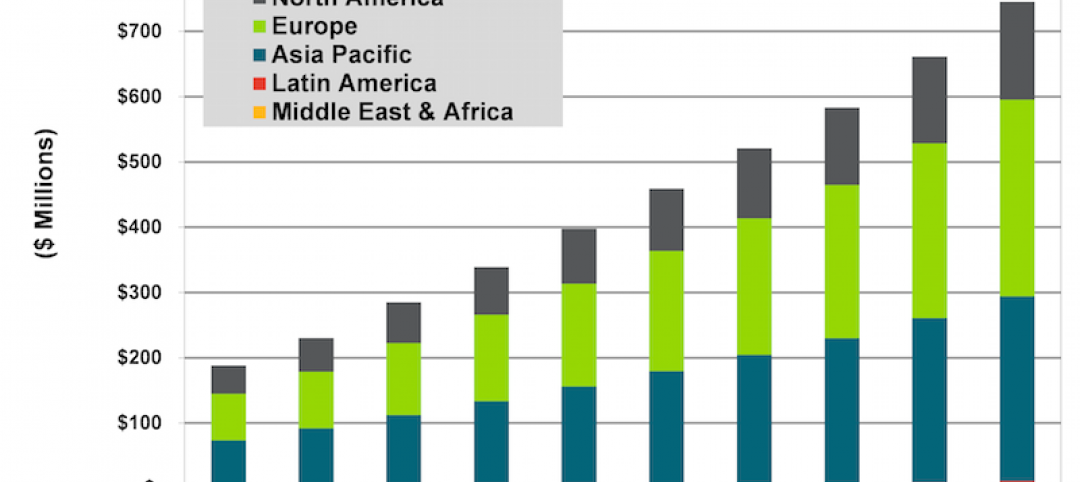
A nascent commercial wireless sensor market is poised to ascend in the next decade
Europe and Asia will propel that growth, according to a new report from Navigant.

Industry Research | Apr 7, 2016
CBRE provides latest insight into healthcare real estate investors’ strategies
Survey respondents are targeting smaller acquisitions, at a time when market cap rates are narrowing for different product types.


