

Providing more evidence of a strengthening economy, Associated Builders and Contractors’ (ABC) Construction Backlog Indicator (CBI) set a record as it expanded to 9.45 months during the third quarter of 2017, up 9.8 percent from the second quarter to the longest backlog reading in the eight-year history of the series. CBI is up by 0.8 months, or 9.2 percent, on a year-over-year basis.
CBI is a leading economic indicator that reflects the amount of construction work under contract, but not yet completed. CBI is measured in months, with a lengthening backlog implying expanding demand for construction services.
“The latest backlog reading strongly suggests the post-2009 economic recovery is picking up steam and that the current construction spending cycle, in place since early 2011 for many contractors, is not on the verge of concluding,” said Basu. “Indeed, if anything, the CBI indicates that nonresidential construction firms are becoming busier due to a confluence of factors, including growing business confidence over the past year and a recent rise in energy prices, which is supporting more investment among energy explorers, producers and distributors.
“With economic growth picking up recently, interest rates staying low, asset prices remaining high and confidence elevated among consumers and businesses alike, the nonresidential construction cycle stands to get even hotter in the near term. That should represent a source of joy to contractors, but undoubtedly many are unnerved by growing pressures to secure suitably trained craftspeople who can support on-time, on-budget project delivery. The upshot is that wage pressures will continue to build in the U.S. construction industry. However, based on the most recent CBI, increasing delivery costs have not yet begun to meaningfully slow the nonresidential construction sector’s ongoing expansion cycle.”

Highlights by Region
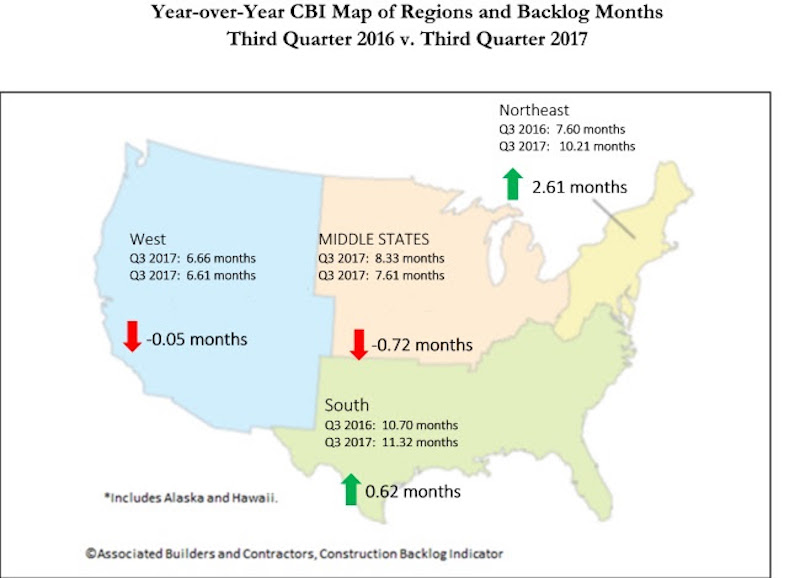
⦁ Backlog in the South surged to 11.3 months during the third quarter, the highest reading in the history of the series. Many will conclude that this is at least partially due to the storms that raced across Texas, Florida and other communities during the quarter, but there are other factors at work, including the ongoing boom in commercial construction in the Dallas, Atlanta and Miami metropolitan areas.
⦁ Increased activity in major cities along the Boston-to-Washington corridor continued to drive backlog data higher in the Northeast. At 10.2 months, the Northeast has matched its lengthiest backlog in the history of the series, in the fourth quarter of 2014.
⦁ Backlog in the Middle States, where growth has been softer in places like Illinois and Kansas, shrank by 0.3 months during the third quarter. Still, regional backlog can be characterized as stable.
⦁ Backlog in the West was slightly shorter during the third quarter and stands at roughly the same level as one year ago. Given the elevated levels of construction apparent in markets like Las Vegas, Portland and San Jose, one can only conclude that the region’s lower average backlog level compared to other regions is at least partially attributable to a very competitive environment associated with an entrepreneurial climate that spawns more start-up construction firms than other parts of the country. Wildfires impacting much of California also likely stalled a certain level of construction and contractual activity during the third quarter.

Highlights by Industry
⦁ Backlog in the commercial/institutional segment expanded briskly, increasing by nearly a full month during the third quarter, and now stands at 9.31 months.
⦁ Average backlog in the heavy industrial category fell to 4.46 months during the third quarter, continuing what has been two years of steady shrinkage aligned with observed declines in construction spending related to U.S. manufacturing.
⦁ Backlog in the infrastructure category expanded during the third quarter to 12.53 months, the highest reading on record for the segment and an indication that improving state and local government finances may finally be translating into higher capital spending.
Highlights by Company Size
⦁ Large firms, those with annual revenues in excess of $100 million, experienced a collective average backlog increase to 13.8 months during the third quarter. Despite the sharp quarterly rise, backlog in the category is virtually unchanged from the same time one year ago.
⦁ Backlog among firms with annual revenues between $50 million and $100 million also surged during the third quarter, increasing by more than two months. Backlog in this category stands at levels last observed in 2013 when the construction recovery began to heat up in earnest.
⦁ Backlog among firms with between $30 million and $50 million in annual revenues lengthened modestly to 11.4 months during the third quarter, the third highest reading on record.
⦁ Backlog for firms with annual revenues less than $30 million remain remarkably stable at 7.7 months. For the past eleven quarters, backlog for this group, which is heavily tilted toward subcontractors, has remained between 7.2 and 8.1 months.
Related Stories

Contractors | Jun 13, 2023
The average U.S. contractor has 8.9 months worth of construction work in the pipeline, as of May 2023
Associated Builders and Contractors reported that its Construction Backlog Indicator remained unchanged at 8.9 months in May, according to an ABC member survey conducted May 20 to June 7. The reading is 0.1 months lower than in May 2022. Backlog in the infrastructure category ticked up again and has now returned to May 2022 levels. On a regional basis, backlog increased in every region but the Northeast.

Industry Research | Jun 13, 2023
Two new surveys track how the construction industry, in the U.S. and globally, is navigating market disruption and volatility
The surveys, conducted by XYZ Reality and KPMG International, found greater willingness to embrace technology, workplace diversity, and ESG precepts.

| Jun 5, 2023
Communication is the key to AEC firms’ mental health programs and training
The core of recent awareness efforts—and their greatest challenge—is getting workers to come forward and share stories.

Contractors | May 24, 2023
The average U.S. contractor has 8.9 months worth of construction work in the pipeline, as of April 2023
Contractor backlogs climbed slightly in April, from a seven-month low the previous month, according to Associated Builders and Contractors.

Multifamily Housing | May 23, 2023
One out of three office buildings in largest U.S. cities are suitable for residential conversion
Roughly one in three office buildings in the largest U.S. cities are well suited to be converted to multifamily residential properties, according to a study by global real estate firm Avison Young. Some 6,206 buildings across 10 U.S. cities present viable opportunities for conversion to residential use.

Industry Research | May 22, 2023
2023 High Growth Study shares tips for finding success in uncertain times
Lee Frederiksen, Managing Partner, Hinge, reveals key takeaways from the firm's recent High Growth study.

Multifamily Housing | May 8, 2023
The average multifamily rent was $1,709 in April 2023, up for the second straight month
Despite economic headwinds, the multifamily housing market continues to demonstrate resilience, according to a new Yardi Matrix report.

Market Data | May 2, 2023
Nonresidential construction spending up 0.7% in March 2023 versus previous month
National nonresidential construction spending increased by 0.7% in March, according to an Associated Builders and Contractors analysis of data published today by the U.S. Census Bureau. On a seasonally adjusted annualized basis, nonresidential spending totaled $997.1 billion for the month.

Hotel Facilities | May 2, 2023
U.S. hotel construction up 9% in the first quarter of 2023, led by Marriott and Hilton
In the latest United States Construction Pipeline Trend Report from Lodging Econometrics (LE), analysts report that construction pipeline projects in the U.S. continue to increase, standing at 5,545 projects/658,207 rooms at the close of Q1 2023. Up 9% by both projects and rooms year-over-year (YOY); project totals at Q1 ‘23 are just 338 projects, or 5.7%, behind the all-time high of 5,883 projects recorded in Q2 2008.

Market Data | May 1, 2023
AEC firm proposal activity rebounds in the first quarter of 2023: PSMJ report
Proposal activity for architecture, engineering and construction (A/E/C) firms increased significantly in the 1st Quarter of 2023, according to PSMJ’s Quarterly Market Forecast (QMF) survey. The predictive measure of the industry’s health rebounded to a net plus/minus index (NPMI) of 32.8 in the first three months of the year.


