

Investors in healthcare buildings view multi-tenant medical offices as their best bets for returns on investments whose financing, to an increasing degree, leans toward cash rather than debt.
Those are some of the findings in a 15-page report that CBRE’s U.S. Healthcare Capital Markets Group has released, based on responses from 80 healthcare real estate investors answering 26 questions. The largest group of respondents (32%) was healthcare real estate developers, followed by healthcare REITs and private capital healthcare investors (27% each).
Nearly one-third (32%) of all respondents say they target transactions that fall between $20 million and $50 million. Another 31% say that their preferred transaction range is $10 million to $20 million. Nearly all of the respondents—96%—are most interested in medical office buildings as the type of building that meets their acquisition criteria. The next preferred building type is ambulatory surgery centers (63%), wellness centers (41%), and assisted living facilities (39%).
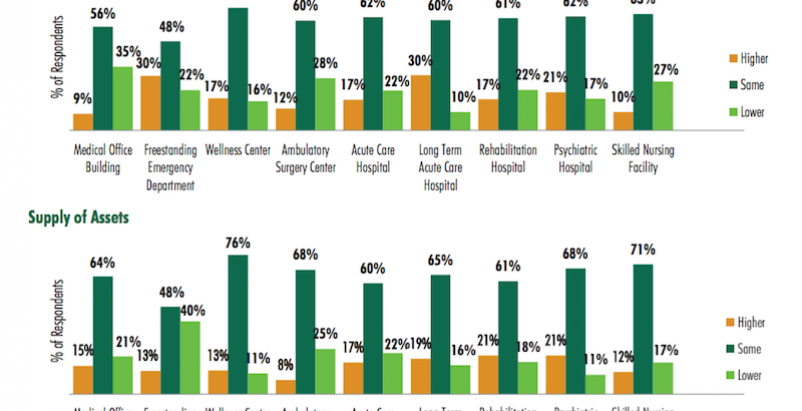 With some notable exceptions, supply (lower row) and demand (upper row) of acqusition properties in the healthcare building sector is expected to be about this same this year as it was in 2015, according to a survey of 80 healthcare real estate investors. Image: CBRE
The total amount of equity that firms allocated for healthcare real estate investment this year, nearly $14.5 billion, was about 7% less than the $15.5 billion estimate from the 2015 survey. But the 2016 number is still considerably higher than estimates in the years 2011 through 2014, and is actually 132% of the total market transaction volume that traded in the healthcare sector in 2015.
The greatest portion of respondents (29%) says leveraged internal rate of return (IRR) is the investment return measurement they rely on most. However, that’s down from 33% in the 2015 survey. On the other hand, all-cash IRR saw a big jump—to 22% from 12% in 2015—as a relied-upon investment metric.
Interestingly, all-cash financing finished second, behind bank debt, as the type of financing the respondents used. Nearly nine of 10 REITs surveyed say they would use all-cash financing, whereas more than three-quarters of the developers would use bank debt to pay for their investments.
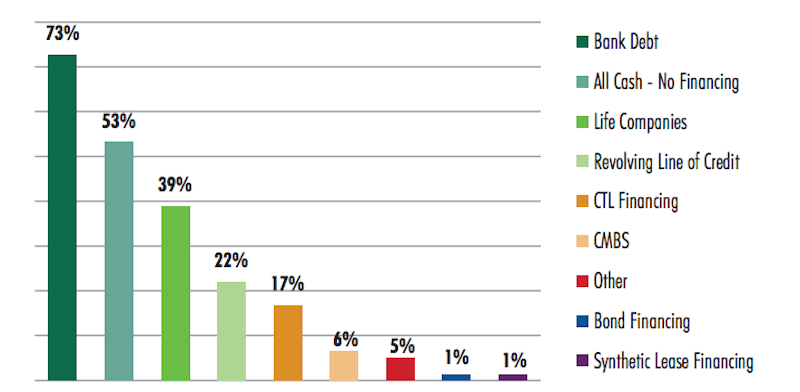
Healthcare REITs says they are more disposed to pay cash for acquisitions of medical office buildings, versus developers that lean more thoward bank financing of their deals. Image: CBRE
There’s wide variation in how long respondents hold onto healthcare investments. The greatest number—31%—say 10 years or more. But another 23% say they will hold only an investment for between five and seven years, and the same percentage are holding onto properties for only two and four year.
Class A on-campus medical office buildings are the healthcare product type that continues to price most aggressively, vis-à-vis Class A off-campus medical offices, although the differences are narrowing, according to this year’s survey. About 49% of respondents indicate that a market cap rate for Class A on-campus medical offices would be below 6%, compared to 53% who say the cap rate for Class A off-campus product would be below 6.5%.
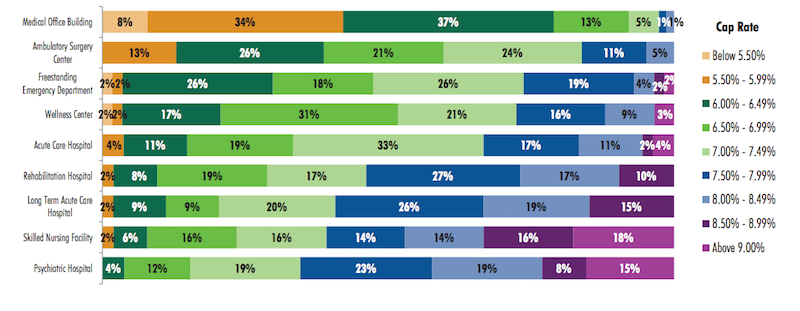
CBRE's survey finds that the market cap rate that investors target varies considerably by product type in the healthcare sector. Image: CBRE
When discussing their target 10-year IRR for all-cash investments in multi-tenant medical office buildings, 42% of respondents say it falls between 7% and 9.49%. Another 31% say their IRR target for this product type would be between 9.5% and 11.99%. “Respondents indicated a lack of desire for the most aggressively priced product, with only 4% indicating a target all-cash IRR below 7%, compared to 17% in 2015,” CBRE reports.
Single-tenant medical office buildings are pricing the most aggressively, with the largest group of respondents (37%) indicating a cap rate range of 6% to 6.49%, and another 42% indicating a cap rate lower than 5.99% In contrast, more than one quarter of respondents indicates a cap rate of 6% to 6.49% for ambulatory surgery centers, while 31% indicate a cap rate range of 6.5% to 6.99% for wellness centers, and 33% a 7% to 7.49% range for acute care hospitals.
The product types with the least-aggressive pricing, according to the survey’s respondents, are long-term acute care hospitals, skilled nursing facilities, and psychiatric hospitals.
The vast majority of respondents—82%—say their medical office investments this year would make them "net buyers."
Majorities of respondents expect supply of and demand for healthcare sector buildings in general to remain pretty much the same this year as in 2015, with some intriguing collisions: for example 30% of respondents think demand for freestanding emergency departments would be higher even as 40% expect supply of that product type would be lower.
Rents for medical office buildings were up between 2% and 3% for the respondents’ portfolios, and none is predicting much growth beyond that in the next 12 months, which is curious given that 59% of those surveyed say their portfolio’s occupancy rates were higher than the year before.
CBRE’s report touches on a host of other investment topics, including operating expenses, credit ratings, acceptable terms for sale-leasebacks (10 to 14 years appears to be the preferred threshold), and issues revolving around ground lease price floors and structuring.
And when the questions home in on developers specifically, nearly half (48%) of developers who responded predict that development request for proposal (RFP) activity would be similar to last year. The biggest number of developers—36%—says that a lease constant of below 7% was the minimum they would consider for a healthcare development opportunity that met their highest standards of investment. (Nearly half says they’d consider a lease constant below 8% for a new development.)
Most developers (44% of those who responded) prefer at least 50% to 60% of a project to be preleased, and a large majority (82%) of developer-respondents require that 50% to 80% of a project to be preleased before they’d invest.
Related Stories

MFPRO+ News | Mar 12, 2024
Multifamily housing starts and permitting activity drop 10% year-over-year
The past year saw over 1.4 million new homes added to the national housing inventory. Despite the 4% growth in units, both the number of new homes under construction and the number of permits dropped year-over-year.

Multifamily Housing | Mar 4, 2024
Single-family rentals continue to grow in BTR communities
Single-family rentals are continuing to grow in built-to-rent communities. Both rent and occupancy growth have been strong in recent months while remaining a financially viable option for renters.

MFPRO+ News | Mar 2, 2024
Job gains boost Yardi Matrix National Rent Forecast for 2024
Multifamily asking rents broke the five-month streak of sequential average declines in January, rising 0.07 percent, shows a new special report from Yardi Matrix.

K-12 Schools | Feb 29, 2024
Average age of U.S. school buildings is just under 50 years
The average age of a main instructional school building in the United States is 49 years, according to a survey by the National Center for Education Statistics (NCES). About 38% of schools were built before 1970. Roughly half of the schools surveyed have undergone a major building renovation or addition.

MFPRO+ Research | Feb 28, 2024
New download: BD+C's 2023 Multifamily Amenities report
New research from Building Design+Construction and Multifamily Pro+ highlights the 127 top amenities that developers, property owners, architects, contractors, and builders are providing in today’s apartment, condominium, student housing, and senior living communities.

MFPRO+ Research | Feb 27, 2024
Most competitive rental markets of early 2024
The U.S. rental market in early 2024 is moderately competitive, with apartments taking an average of 41 days to find tenants, according to the latest RentCafe Market Competitivity Report.

Student Housing | Feb 21, 2024
Student housing preleasing continues to grow at record pace
Student housing preleasing continues to be robust even as rent growth has decelerated, according to the latest Yardi Matrix National Student Housing Report.

Multifamily Housing | Feb 14, 2024
Multifamily rent remains flat at $1,710 in January
The multifamily market was stable at the start of 2024, despite the pressure of a supply boom in some markets, according to the latest Yardi Matrix National Multifamily Report.

Industry Research | Feb 8, 2024
New multifamily development in 2023 exceeded expectations
Despite a problematic financing environment, 2023 multifamily construction starts held up “remarkably well” according to the latest Yardi Matrix report.
Industry Research | Jan 31, 2024
ASID identifies 11 design trends coming in 2024
The Trends Outlook Report by the American Society of Interior Designers (ASID) is the first of a three-part outlook series on interior design. This design trends report demonstrates the importance of connection and authenticity.


