According to the year-end Lodging Econometrics (LE) Construction Pipeline Trend Report for Canada, analysts at LE state that Canada’s hotel construction pipeline ended 2021’s fourth quarter at 262 projects/35,325 rooms. The pipeline is down a mere 3% by projects and up 2% by rooms, year-over-year (YOY).
At the close of 2021, projects under construction stand at 62 projects/8,100 rooms. Projects scheduled to start construction in the next 12 months stand at 85 projects/10,536 rooms and projects in the early planning stage are at an all-time high at Q4 with 115 projects/16,689 rooms, a 15% increase by projects and 14% by rooms YOY.
Leisure and business travel has increased in recent months thanks to the holiday season and the country’s COVID booster rollout program, that was executed more quickly than expected.
Ontario continues to lead Canada’s construction pipeline in Q4, reaching the province’s highest project count since Q4‘19, with 154 projects/19,818 rooms. Ontario accounts for 59% of the projects and 56% of the rooms in Canada’s total pipeline. British Columbia follows with 37 projects/5,675 rooms, then Alberta with 24 projects/3,739 rooms, and Quebec with 18 projects/2,481 rooms.
Markets with the most projects in the pipeline continue to be led by Toronto, at an all-time high, with 65 projects/9,621 rooms. Toronto, alone, has 25% of all the projects in Canada’s construction pipeline. Distantly following are Vancouver with 14 projects/2,016, then Niagara Falls with 13 projects/2,341 rooms, Montreal with 13 projects/1,956 rooms, and Ottawa with 10 projects/1,694 rooms. These top five cities, combined, account for 44% of the projects and 50% of the rooms in Canada’s total pipeline.
The top hotel franchise company in Canada's construction pipeline at Q4‘21 is Marriott International, at all-time high of 71 projects/8,890 rooms. Hilton Worldwide follows closely with 65 projects/7,870 rooms, then InterContinental Hotels Group (IHG) with 47 projects/4,732 rooms. These three companies claim 70% of the projects and 61% of the rooms in the country’s total construction pipeline.
The top brands in Canada’s pipeline are Hampton by Hilton, with 26 projects/2,946 rooms and IHG’s Holiday Inn Express, with 24 projects/2,461 rooms. Next is Marriott’s TownePlace Suites, at record counts, with 17 projects/1,817 rooms. This is followed by Hilton’s Home2Suites with 16 projects/1,706 rooms, then Marriott’s Fairfield Inn brand with 16 projects/1,533 rooms.
Canada had 35 new hotels with 3,742 rooms open in 2021 at a growth rate of 1.1%. In 2022, the country is forecast to have a growth rate of 1.2% with 38 new hotels/4,251 rooms expected to open. LE is forecasting a slight increase in Canada’s growth rate to 1.3% in 2023 and expects 41 new hotels/4,632 rooms to open by year-end.
Related Stories
Apartments | Aug 22, 2023
Key takeaways from RCLCO's 2023 apartment renter preferences study
Gregg Logan, Managing Director of real estate consulting firm RCLCO, reveals the highlights of RCLCO's new research study, “2023 Rental Consumer Preferences Report.” Logan speaks with BD+C's Robert Cassidy.
Market Data | Aug 18, 2023
Construction soldiers on, despite rising materials and labor costs
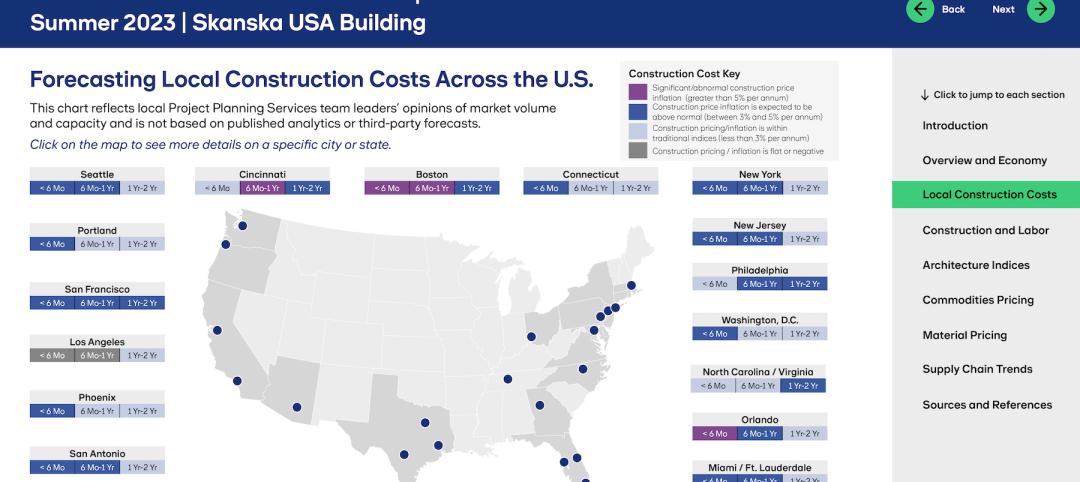
Quarterly analyses from Skanska, Mortenson, and Gordian show nonresidential building still subject to materials and labor volatility, and regional disparities.
Apartments | Aug 14, 2023
Yardi Matrix updates near-term multifamily supply forecast
The multifamily housing supply could increase by up to nearly 7% by the end of 2023, states the latest Multifamily Supply Forecast from Yardi Matrix.
Hotel Facilities | Aug 2, 2023
Top 5 markets for hotel construction
According to the United States Construction Pipeline Trend Report by Lodging Econometrics (LE) for Q2 2023, the five markets with the largest hotel construction pipelines are Dallas with a record-high 184 projects/21,501 rooms, Atlanta with 141 projects/17,993 rooms, Phoenix with 119 projects/16,107 rooms, Nashville with 116 projects/15,346 rooms, and Los Angeles with 112 projects/17,797 rooms.
Market Data | Aug 1, 2023
Nonresidential construction spending increases slightly in June
National nonresidential construction spending increased 0.1% in June, according to an Associated Builders and Contractors analysis of data published today by the U.S. Census Bureau. Spending is up 18% over the past 12 months. On a seasonally adjusted annualized basis, nonresidential spending totaled $1.07 trillion in June.
Hotel Facilities | Jul 27, 2023
U.S. hotel construction pipeline remains steady with 5,572 projects in the works
The hotel construction pipeline grew incrementally in Q2 2023 as developers and franchise companies push through short-term challenges while envisioning long-term prospects, according to Lodging Econometrics.
Hotel Facilities | Jul 26, 2023
Hospitality building construction costs for 2023
Data from Gordian breaks down the average cost per square foot for 15-story hotels, restaurants, fast food restaurants, and movie theaters across 10 U.S. cities: Boston, Chicago, Las Vegas, Los Angeles, Miami, New Orleans, New York, Phoenix, Seattle, and Washington, D.C.
Market Data | Jul 24, 2023
Leading economists call for 2% increase in building construction spending in 2024
Following a 19.7% surge in spending for commercial, institutional, and industrial buildings in 2023, leading construction industry economists expect spending growth to come back to earth in 2024, according to the July 2023 AIA Consensus Construction Forecast Panel.
Contractors | Jul 13, 2023
Construction input prices remain unchanged in June, inflation slowing
Construction input prices remained unchanged in June compared to the previous month, according to an Associated Builders and Contractors analysis of U.S. Bureau of Labor Statistics Producer Price Index data released today. Nonresidential construction input prices were also unchanged for the month.
Contractors | Jul 11, 2023
The average U.S. contractor has 8.9 months worth of construction work in the pipeline, as of June 2023
Associated Builders and Contractors reported that its Construction Backlog Indicator remained unchanged at 8.9 months in June 2023, according to an ABC member survey conducted June 20 to July 5. The reading is unchanged from June 2022.


