


The recent evolution of airport terminals has been prompted largely by different patterns of passenger behavior in a post-9/11 world. Passengers have learned get to the airport earlier. They spend less time browsing pre-security retail, opting to queue up in often-lengthy security lines well before boarding. The result? Overcrowding in post-security areas, where retail and dining options have historically been lacking.
Curtis Fentress, Principal-in-Charge of design at Fentress Architects, says greater passenger volume has strained gate and restroom capabilities. In addition, the recent popularity of low-cost airlines has increased demand for post-security dining options.
“Many carriers don’t provide any food on the airplane,” Fentress says. “So the people who are getting to the airport earlier to make sure they get through security are waiting, and they want something to eat. If there’s any kind of flight delay, they know they might be stuck in the airport or stuck up in the air for a while without any food.”
Airports are scrambling to respond with renovations and new terminals, even as they deal with TSA rules that can change in an instant. From CTX scanners—van-sized x-ray machines used to examine checked bags—to passenger scanners, the range of large equipment that terminals must accommodate just keeps morphing. Building Teams and their clients are adopting structural tactics that support change.
“We’re using more steel, which allows us to make longer distances between columns,” Fentress says. “The more long-span construction you can do, the more flexibility you have in the future.”
Top Air Terminal Sector Architecture Firms
| Rank | Company | 2013 Air Terminal Revenue Revenue |
| 1 | HOK | $47,074,837 |
| 2 | Gensler | 35,675,000 |
| 3 | Kohn Pedersen Fox Associates | 30,792,300 |
| 4 | Corgan | 26,376,420 |
| 5 | Fentress Architects | 26,333,785 |
| 6 | Stantec | 22,650,631 |
| 7 | RS&H | 22,050,000 |
| 8 | Skidmore, Owings & Merrill | 20,454,225 |
| 9 | PGAL | 17,120,000 |
| 10 | Heery International | 13,057,793 |
| 11 | HNTB Corp. | 10,900,639 |
| 12 | Leo A Daly | 9,490,737 |
| 13 | Gresham, Smith and Partners | 6,733,000 |
| 14 | SchenkelShultz Architecture | 6,179,000 |
| 15 | HKS | 4,087,622 |
| 16 | LS3P | 3,282,241 |
| 17 | Morris Architects | 2,795,000 |
| 18 | Clark Nexsen | 2,214,183 |
| 19 | Solomon Cordwell Buenz | 1,700,000 |
| 20 | CTA Architects Engineers | 1,187,913 |
| 21 | ZGF Architects | 929,658 |
| 22 | BRPH | 925,000 |
| 23 | Epstein | 762,000 |
| 24 | RTKL Associates | 677,000 |
| 25 | Integrus Architecture | 641,695 |
| 26 | Ware Malcomb | 196,500 |
| 27 | Rosser International | 158,668 |
| 28 | JRS Architect | 135,000 |
| 29 | Environetics | 112,443 |
| 30 | Parkhill, Smith & Cooper | 92,000 |
| 31 | Cuningham Group Architecture | 44,964 |
| 32 | Beyer Blinder Belle | 9,544 |
| 33 | Perkins+will | 6,836 |
| 34 | Ratio Architects | 5,368 |
Top Air Terminal Sector Engineering Firms
| Rank | Company | 2013 Air Terminal Revenue Revenue |
| 1 | Jacobs | $118,990,000 |
| 2 | URS Corp. | 83,069,612 |
| 3 | Burns & McDonnell | 48,010,000 |
| 4 | Parsons Brinckerhoff | 27,025,899 |
| 5 | Arup | 21,447,760 |
| 6 | Leidos | 16,810,000 |
| 7 | Ross & Baruzzini | 12,814,720 |
| 8 | AECOM Technology Corp. | 9,630,000 |
| 9 | STV | 5,260,000 |
| 10 | WSP Group | 3,640,000 |
| 11 | KPFF Consulting Engineers | 3,125,000 |
| 12 | Syska Hennessy Group | 2,933,760 |
| 13 | TLC Engineering for Architecture | 1,984,605 |
| 14 | TTG | 1,653,250 |
| 15 | Thornton Tomasetti | 1,620,411 |
| 16 | Walter P Moore and Associates | 1,596,212 |
| 17 | Sparling | 1,583,537 |
| 18 | Stanley Consultants | 1,526,482 |
| 19 | Aon Fire Protection Engineering Corp. | 1,500,000 |
| 20 | Graef | 1,267,799 |
| 21 | RMF Engineering | 1,200,000 |
| 22 | Coffman Engineers | 1,139,884 |
| 23 | Magnusson Klemencic Associates | 1,068,015 |
| 24 | RDK Engineers | 870,000 |
| 25 | Vanderweil Engineers | 856,900 |
| 26 | Wiss, Janney, Elstner Associates | 550,000 |
| 27 | Simpson Gumpertz & Heger | 550,000 |
| 28 | Martin/Martin | 494,691 |
| 29 | M-E Engineers | 400,000 |
| 30 | Newcomb & Boyd | 351,932 |
| 31 | Zak Companies | 351,488 |
| 32 | I. C. Thomasson Associates | 300,000 |
| 33 | Davis, Bowen & Friedel | 257,524 |
| 34 | Guernsey | 252,705 |
| 35 | Environmental Systems Design | 198,068 |
| 36 | CTLGroup | 180,000 |
| 37 | Joseph R. Loring & Associates | 175,000 |
| 38 | Heapy Engineering | 172,189 |
| 39 | Barge Waggoner Sumner & Cannon | 150,000 |
| 40 | GRW | 138,862 |
| 41 | Wallace Engineering | 131,000 |
| 42 | Dunham Associates | 90,000 |
| 43 | CJL Engineering | 81,400 |
| 44 | KJWW Engineering Consultants | 81,358 |
| 45 | P2S Engineering | 50,418 |
| 46 | Smith Seckman Reid | 44,419 |
| 47 | Bridgers & Paxton Consulting Engineers | 38,111 |
| 48 | Spectrum Engineers | 16,993 |
| 49 | Brinjac Engineering | 12,515 |
| 50 | French & Parrello Associates | 9,215 |
| 51 | AKF Group | 6,000 |
Top Air Terminal Sector Construction Firms
| Rank | Company | 2013 Air Terminal Revenue Revenue |
| 1 | Turner Construction | $487,680,000 |
| 2 | Hensel Phelps | 418,780,000 |
| 3 | PCL Construction | 328,069,635 |
| 4 | Walsh Group, The | 315,399,703 |
| 5 | Austin Commercial | 267,162,953 |
| 6 | Suffolk Construction | 170,270,605 |
| 7 | Balfour Beatty US | 154,058,403 |
| 8 | Clark Group | 131,741,104 |
| 9 | McCarthy Holdings | 127,000,000 |
| 10 | Manhattan Construction | 119,660,000 |
| 11 | Hunt Construction Group | 109,000,000 |
| 12 | URS Corp. | 83,069,612 |
| 13 | Hill International | 55,000,000 |
| 14 | Flintco | 54,400,000 |
| 15 | Walbridge | 46,000,000 |
| 16 | Skanska USA | 45,635,393 |
| 17 | Lend Lease | 35,107,000 |
| 18 | Weitz Company, The | 33,745,047 |
| 19 | HITT Contracting | 27,200,000 |
| 20 | Parsons Brinckerhoff | 27,025,899 |
| 21 | Brasfield & Gorrie | 25,926,312 |
| 22 | Gilbane | 22,031,250 |
| 23 | Tutor Perini Corp. | 19,320,308 |
| 24 | New South Construction | 18,923,000 |
| 25 | BlueScope Construction | 18,631,283 |
| 26 | O'Neil Industries/W.E. O'Neil | 18,433,037 |
| 27 | Holder Construction | 13,132,000 |
| 28 | Heery International | 13,057,793 |
| 29 | Yates Companies, The | 12,900,000 |
| 30 | Whiting-Turner Contracting Co., The | 11,991,159 |
| 31 | Beck Group, The | 11,096,174 |
| 32 | EMJ Corp. | 10,000,000 |
| 33 | James McHugh Construction | 9,527,392 |
| 34 | Robins & Morton | 6,370,178 |
| 35 | Messer Construction | 5,994,758 |
| 36 | W. M. Jordan Company | 5,812,917 |
| 37 | STV | 5,260,000 |
| 38 | Hill & Wilkinson | 4,766,000 |
| 39 | Consigli Construction | 3,278,099 |
| 40 | Kraus-Anderson Construction | 3,000,000 |
| 41 | Sundt Construction | 1,564,147 |
| 42 | JE Dunn Construction | 1,239,884 |
| 43 | Hoffman Construction | 1,000,000 |
| 44 | Hoar Construction | 4,000 |
Read BD+C's full 2014 Giants 300 Report
Related Stories
| May 11, 2014
Final call for entries: 2014 Giants 300 survey
BD+C's 2014 Giants 300 survey forms are due Wednesday, May 21. Survey results will be published in our July 2014 issue. The annual Giants 300 Report ranks the top AEC firms in commercial construction, by revenue.

| Apr 29, 2014
USGBC launches real-time green building data dashboard
The online data visualization resource highlights green building data for each state and Washington, D.C.

| Apr 22, 2014
Bright and bustling: Grimshaw reveals plans for the Istanbul Grand Airport [slideshow]
In partnership with the Nordic Office of Architecture and Haptic Architects, Grimshaw Architects has revealed its plans for the terminal of what will be one of the world's busiest airports. The terminal is expected to serve 150 million passengers per year.
 in progress. For additional technical infor")
| Apr 9, 2014
Steel decks: 11 tips for their proper use | BD+C
Building Teams have been using steel decks with proven success for 75 years. Building Design+Construction consulted with technical experts from the Steel Deck Institute and the deck manufacturing industry for their advice on how best to use steel decking.
| Apr 4, 2014
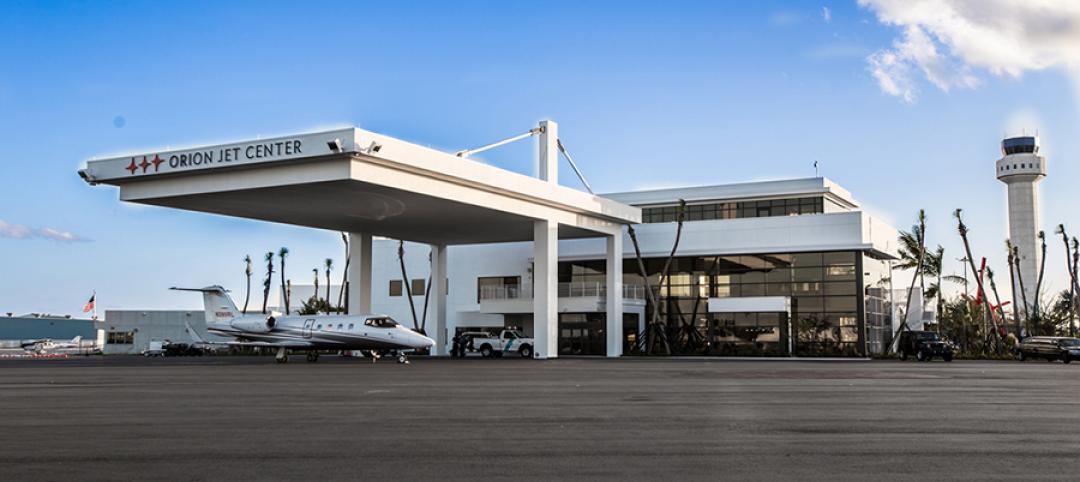
$25 million Orion Jet Center designed by SchenkelShultz now open
As the centerpiece of the 45-acre campus, which is its first phase of a planned 215-acre mixed-use development, the 18,000 square foot executive terminal facility offers spacious passenger areas, administrative space, an executive suite, rental car kiosk, catering and a cafe.

| Apr 2, 2014
8 tips for avoiding thermal bridges in window applications
Aligning thermal breaks and applying air barriers are among the top design and installation tricks recommended by building enclosure experts.
| Mar 26, 2014
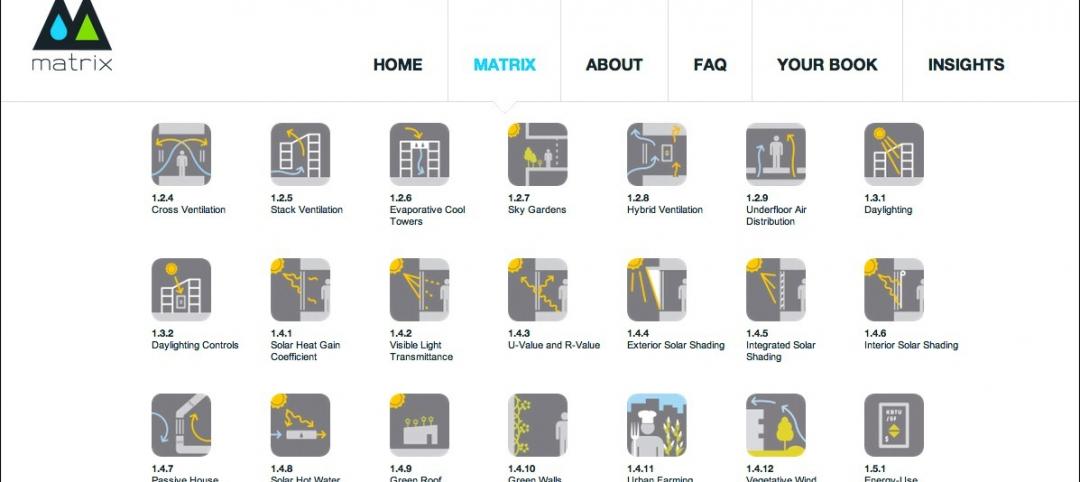
Callison launches sustainable design tool with 84 proven strategies
Hybrid ventilation, nighttime cooling, and fuel cell technology are among the dozens of sustainable design techniques profiled by Callison on its new website, Matrix.Callison.com.

| Mar 20, 2014
Common EIFS failures, and how to prevent them
Poor workmanship, impact damage, building movement, and incompatible or unsound substrate are among the major culprits of EIFS problems.

| Mar 12, 2014
14 new ideas for doors and door hardware
From a high-tech classroom lockdown system to an impact-resistant wide-stile door line, BD+C editors present a collection of door and door hardware innovations.

| Mar 5, 2014
5 tile design trends for 2014
Beveled, geometric, and high-tech patterns are among the hot ceramic tile trends, say tile design experts.


